emi12728-sup-0001-si
advertisement
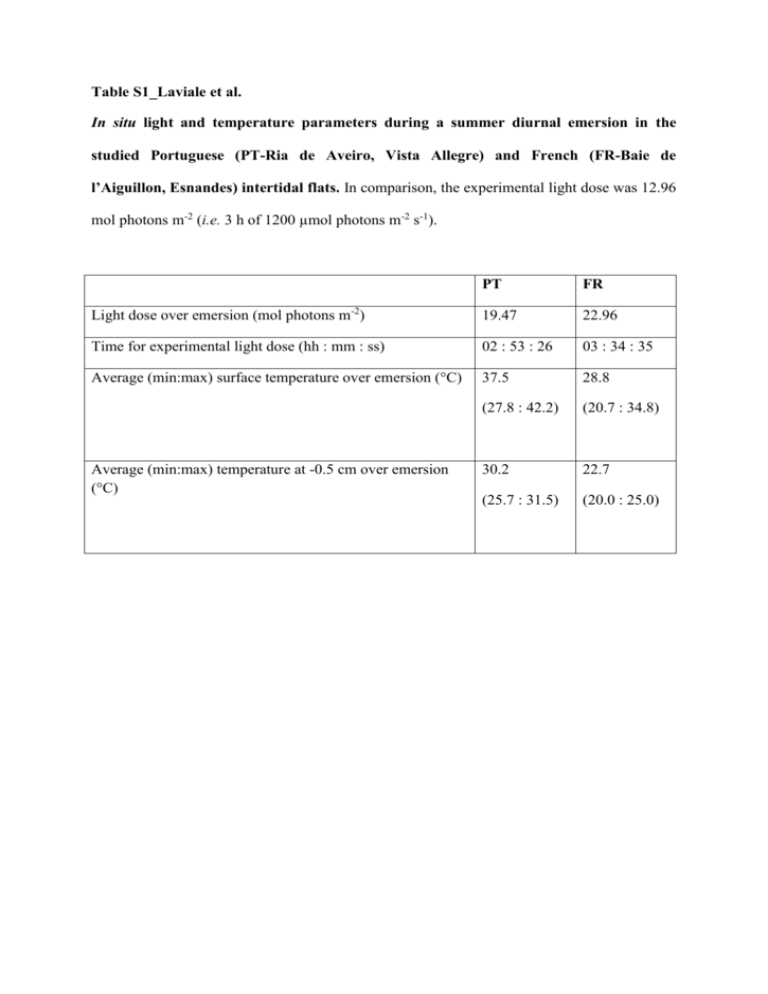
Table S1_Laviale et al. In situ light and temperature parameters during a summer diurnal emersion in the studied Portuguese (PT-Ria de Aveiro, Vista Allegre) and French (FR-Baie de l’Aiguillon, Esnandes) intertidal flats. In comparison, the experimental light dose was 12.96 mol photons m-2 (i.e. 3 h of 1200 µmol photons m-2 s-1). PT FR Light dose over emersion (mol photons m-2) 19.47 22.96 Time for experimental light dose (hh : mm : ss) 02 : 53 : 26 03 : 34 : 35 Average (min:max) surface temperature over emersion (°C) 37.5 28.8 (27.8 : 42.2) (20.7 : 34.8) 30.2 22.7 (25.7 : 31.5) (20.0 : 25.0) Average (min:max) temperature at -0.5 cm over emersion (°C) Table S2_Laviale et al. Relative abundances of benthic diatoms species sampled in the first cm of the sediment in the studied Portuguese (PT-Ria de Aveiro, Vista Allegre) and French (FR-Baie de l’Aiguillon, Esnandes) intertidal flats. Identified species were epipelic (i.e. motile), unless stated as phytoplanktonic (*) or thychoplanktonic species (**); s.l.: sensu lato. ‘Other’ brings together diatoms species with a relative abundance < 1%. Species name PT site Navicula phyllepta s.l. Melosira sp.* Staurophora amphioxys Diploneis didyma Amphora spp. Nitzschia acuminata Nitzschia sp. 1 Psammodictyon panduriforme Paralia sulcata* Surrirella sp. Other FR site Navicula spartinetensis Navicula phyllepta s.l. Plagiotropis seriata Cymatosira belgica** Nitzchia sp. 2 Psammodictyon panduriforme Thalassiosira sp.* Other Relative abundance (%) 44.2 9.4 8.4 7.3 6.5 5.8 4.5 4.2 3.1 1.0 5.5 33 28 8 5 4 4 3 15 Table S3_Laviale et al. Outputs of the statistical analysis performed on FR data set (a: PSII; b: NPQ; c: Chl a allomerization ratio (AR); d: DD+DT pool; e: DD de-epoxidation state (DES); f: TBARS content (MDA). Time (T0, after 3 h of HL, after 15 min recovery under LL), temperature (27°C and 37°C) and chemical (Ctrl or +Lat A) were considered as fixed factors. The fact that PSII and NPQ measurements were made on the same samples over the experiment was also taken into account (i.e. related samples). Level of significance indicated as: ‘***’ (P < 0.001), ‘**’ (P < 0.01), ‘*’ (P < 0.05). a PSII time temperature chemical time x temperature time x chemical temperature x chemical time x temperature x chemical b Pr (> F) < 2e-16 6.94E-11 0.0014 2.30E-10 0.0217 0.0937 0.3754 significance *** *** ** *** * df 2 1 1 2 2 1 2 F value 905.5 77.3 7.6 28.0 2.4 0.9 0.4 Pr (> F) < 2e-16 5.72E-09 0.0110 5.35E-07 0.1120 0.35200 0.700 significance *** *** * *** df 2 1 1 2 2 1 2 F value 19.0 0.5 10.5 0.7 2.9 0.8 0.2 Pr (> F) 9.50E-06 0.4762 0.0033 5.28E-01 0.0727 0.39342 0.800 significance *** df 2 F value 109.9 Pr (> F) 2.90E-14 significance *** AR time temperature chemical time x temperature time x chemical temperature x chemical time x temperature x chemical d F value 703.3 135.8 13.4 71.7 4.6 3.1 1.3 NPQ time temperature chemical time x temperature time x chemical temperature x chemical time x temperature x chemical c df 2 1 1 2 2 1 2 ** DD+DT pool time temperature chemical time x temperature time x chemical temperature x chemical time x temperature x chemical e 7.3 0.4 2.9 0.1 0.1 0.4 0.0113 0.5374 0.0695 0.8801 0.7969 0.6709 * df 2 1 1 2 2 1 2 F value 398.6 197.8 113.2 70.0 43.8 26.2 19.0 Pr (> F) < 2e-16 2.23E-13 9.02E-11 5.69E-11 6.78E-09 2.72E-05 9.73E-06 significance *** *** *** *** *** *** *** df 2 1 1 2 2 1 2 F value 0.4 1.7 0.0 0.1 4.3 0.1 1.6 Pr (> F) 0.7055 0.1934 0.9933 0.9092 0.0202 0.792 0.2201 significance DES time temperature chemical time x temperature time x chemical temperature x chemical time x temperature x chemical f 1 1 2 2 1 2 MDA time temperature chemical time x temperature time x chemical temperature x chemical time x temperature x chemical * Table S4_Laviale et al. Outputs of the statistical analysis performed on data gathered after 15 min recovery under LL (a: PSII; b: NPQ). Site (PT or FR), chemical (Ctrl or +Lat A) and temperature (27 or 37°C) were considered as fixed factors. Level of significance indicated as: ‘***’ (P < 0.001), ‘**’ (P < 0.01), ‘*’ (P < 0.05). a PSII site temperature chemical site x temperature site x chemical temperature x chemical site x temperature x chemical b df 1 1 1 1 1 1 1 F value 148.9 119.2 38.9 38.2 7.5 0.1 4.2 Pr (> F) < 2e-16 2.94E-16 3.93E-08 4.90E-08 0.00817 0.73927 0.04334 significance *** *** *** *** ** df 1 1 1 1 1 1 1 F value 12.5 78.9 15.7 1.1 0.04 1.5 0.04 Pr (> F) 0.00276 1.38E-07 0.00112 0.30759 0.85480 0.23905 0.85480 significance ** *** ** * NPQ site temperature chemical site x temperature site x chemical temperature x chemical site x temperature x chemical Figure S1_Laviale et al. A B AR (%) 20 27°C FR Ctrl FR + Lat A 20 15 15 10 10 5 5 0 T0 HL Recov LL 0 37°C T0 HL Recov LL Pigment content makers of photooxidative stress (Chl a allomerization ratio, AR) of microphytobenthos harvested at the French site (FR-Baie de l’Aiguillon, Esnandes) during light stress recovery experiments performed on sediment exposed at two temperatures (27°C, A- or 37°C, B-) and with an inhibitor of cell motility (+Lat A) or without (Ctrl). T0, beginning of the experiment under low light (50 µmol photons m-2 s-1); HL, after 3 h high light (1200 µmol photons m-2 s-1); Recov, after 15 min recovery under low light (50 µmol photons m-2 s-1) following the 3 h high light; LL, after 3 h of low light (50 µmol photons m-2 s-1). Values are mean ± SD (n=6). Figure S2_Laviale et al. B DD+DT (mol. 100 mol Chl a-1) A 80 80 37°C 27°C FR Ctrl FR + Lat A 60 60 40 40 20 20 0 T 0 HL Recov LL 0 T0 HL Recov LL Pigment content markers of photoprotection (DD+DT pool normalized to total Chl a) of microphytobenthos harvested at the French site (FR-Baie de l’Aiguillon, Esnandes) during light stress recovery experiments performed on sediment exposed at two temperatures (27°C, A- or 37°C, B-) and with an inhibitor of cell motility (+ Lat A) or without (Ctrl). Labels as in Fig. S1. Values are mean ± SD (n=6). Figure S3_Laviale et al. A B 80 27°C DES (%) FR Ctrl FR + Lat A 80 37°C 60 60 40 40 20 20 0 T0 HL Recov LL 0 T0 HL Recov LL Pigment content markers of photoprotection (DD de-epoxidation state, DES, in mol 100 mol Chl a-1) of microphytobenthos harvested at the French site (FR-Baie de l’Aiguillon, Esnandes) during light stress recovery experiments on sediment exposed at two temperatures (27°C, A- or 37°C, B-) and with an inhibitor of cell motility (+ Lat A) or without (Ctrl). Labels as in Fig. S1. Values are mean ± SD (n=6). Figure S4_Laviale et al. 2 - Lat A NPQ = -3.41 + 0.21 DES R = 0.83 + Lat A NPQ = -1.18 + 0.08 DES R = 0.92 2 5 NPQ 4 - Lat A + Lat A 3 2 1 0 0 10 20 30 40 50 60 70 80 DES (%) DES (DD de-epoxidation state, DES, in mol. 100 mol Chl a-1) versus NPQ (nonphotochemical quenching of Chl a fluorescence, an index of photoprotection) relationship for MPB harvested at the French site (FR-Baie de l’Aiguillon, Esnandes) during light stress experiments (LSRE) performed on sediment exposed at two temperatures (27°C or 37°C) and with an inhibitor of cell motility (+ Lat A) or without (Ctrl). Data are from Fig. S3 and Fig. 3. Figure S5_Laviale et al. MDA equivalent / Idiat 5 PT + Lat A, 27°C PT + Lat A, 37°C 4 3 2 1 0 T0 HL Recov LL Amount of lipid peroxidation marker (TBARS content in 10-6 nmol MDA equivalent mL-1) in MPB harvested at the Portuguese site (PT-Ria de Aveiro, Vista Allegre) during light stress experiments (LSRE) performed on sediment exposed at two temperatures (27°C, A- or 37°C, B-) with an inhibitor of cell motility (+ Lat A). Labels as in Fig. S1. Values are mean ± SD (n=6).
