(90980) 2014 Assessment Schedule
advertisement
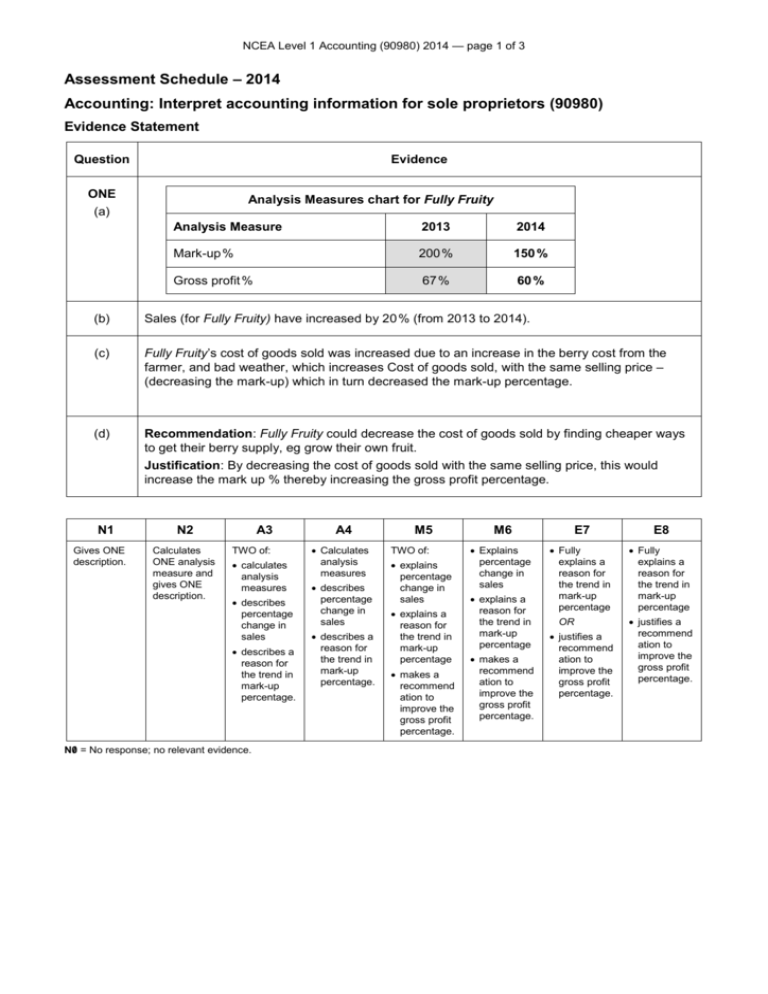
NCEA Level 1 Accounting (90980) 2014 — page 1 of 3 Assessment Schedule – 2014 Accounting: Interpret accounting information for sole proprietors (90980) Evidence Statement Question Evidence ONE Analysis Measures chart for Fully Fruity (a) Analysis Measure 2013 2014 Mark-up % 200 % 150 % Gross profit % 67 % 60 % (b) Sales (for Fully Fruity) have increased by 20 % (from 2013 to 2014). (c) Fully Fruity’s cost of goods sold was increased due to an increase in the berry cost from the farmer, and bad weather, which increases Cost of goods sold, with the same selling price – (decreasing the mark-up) which in turn decreased the mark-up percentage. (d) Recommendation: Fully Fruity could decrease the cost of goods sold by finding cheaper ways to get their berry supply, eg grow their own fruit. Justification: By decreasing the cost of goods sold with the same selling price, this would increase the mark up % thereby increasing the gross profit percentage. N1 Gives ONE description. N2 Calculates ONE analysis measure and gives ONE description. A3 TWO of: calculates analysis measures describes percentage change in sales describes a reason for the trend in mark-up percentage. N0/ = No response; no relevant evidence. A4 Calculates analysis measures describes percentage change in sales describes a reason for the trend in mark-up percentage. M5 TWO of: explains percentage change in sales explains a reason for the trend in mark-up percentage makes a recommend ation to improve the gross profit percentage. M6 E7 E8 Explains percentage change in sales Fully explains a reason for the trend in mark-up percentage Fully explains a reason for the trend in mark-up percentage explains a reason for the trend in mark-up percentage makes a recommend ation to improve the gross profit percentage. OR justifies a recommend ation to improve the gross profit percentage. justifies a recommend ation to improve the gross profit percentage. NCEA Level 1 Accounting (90980) 2014 — page 2 of 3 Question Evidence TWO (a) (b) Analysis Measure 2013 2014 Distribution costs % 15 % 20 % Profit for the year % 50 % 40 % In 2013, for every dollar of sales 50 cents was profit for the year for Fully Fruity. Reason for the profit for the period trend: Full Fruity have employed more staff to maintain the excellent customer service. This resulted in an increase in the sales wages, which increased the distribution cost, increasing the distribution cost percentage. An increase in maintenance costs on the 15-year-old truck led to an increase in truck repairs, increasing distribution costs, increasing the distribution cost percentage. Recommendation: Fully Fruity could improve the profit for the year percentage by getting a more fuel-efficient truck (or any other relevant recommendation). Justification: Getting a more fuel-efficient truck would decrease the petrol expense, decrease the distribution expense, increase the profit for the year (or decreasing total expenses/%), increasing the profit for the year percentage. N1 Gives ONE description. N2 Calculates ONE analysis measure and gives ONE description. A3 A4 Calculates analysis measures Calculates analysis measures AND AND ONE of: describes the profit for the year percentage describes the profit for the year percentage describes a reason for the trend in distribution cost percentage. N0/ = No response; no relevant evidence. describes a reason for the trend in distribution cost percentage. M5 ONE of: explains a reason for the trend in distribution cost percentage makes a recommendation for improving profit for the year percentage. M6 E7 E8 Explains a reason for the trend in distribution cost percentage Fully explains a reason for the trend in distribution cost percentage Fully explains a reason for the trend in distribution cost percentage makes a recommendation for improving profit for the year percentage. OR justifies a recommendation for improving profit for the year percentage. justifies a recommendation for improving profit for the year percentage NCEA Level 1 Accounting (90980) 2014 — page 3 of 3 Question Evidence THREE Ratio 2013 2014 Current ratio 2.5: 1 3.3: 1 Liquid ratio 2.3: 1 3.1: 1 (a) (b) The liquid ratio for 2013 means for every dollar of immediate / liquid liabilities, Fully Fruity had $2.30 of immediate / liquid assets. This means that Fully Fruity can meet its immediate debt. (c) A possible reason for the increase in the liquid ratio is that Fully Fruity sold inventory for a profit for cash, which increased bank, which increased liquid assets – thereby increasing the liquid ratio. This also increased the current ratio, as bank is a liquid asset and a current asset that is increased by more than the decrease in inventory. OR Ula invested extra cash into the business, which increased bank and liquid assets, which in turn increased the liquid ratio. This also increased the current ratio, as bank is a liquid asset and a current asset that is increased. (d) Recommendation: Fully Fruity could improve the current and liquid ratios to be closer to the industry average by investing some of the cash in bank into a long-term investment, eg term deposit, or buying a new truck. Justification: This decreases asset bank, decreasing the current and liquid assets – which in turn could decrease the current and liquid ratios. This means that Fully Fruity would be able to earn additional interest and income. N1 Gives ONE description. N2 A3 Calculates analysis measure and gives ONE description. TWO of: calculates analysis measure describes the liquid ratio describes a reason for the trend in liquid ratio. A4 M5 Calculates analysis measure TWO of: describes the liquid ratio makes a recommendation for improving the current / liquid ratio describes a reason for the trend in liquid ratio. explains the liquid ratio explains a reason for the trend in liquid ratio. M6 E7 E8 Explains the liquid ratio Fully explains the trend in the liquid ratio Fully explains the trend in the liquid ratio makes a recommendation for improving the current / liquid ratio explains a reason for the trend in liquid ratio. OR justifies a recommendation for improving the current and liquid ratios. justifies a recommendation for improving the current and liquid ratios. N0/ = No response; no relevant evidence. Cut Scores Score range Not Achieved Achievement Achievement with Merit Achievement with Excellence 0–6 7 – 12 13 – 18 19 – 24


