N - BioMed Central
advertisement
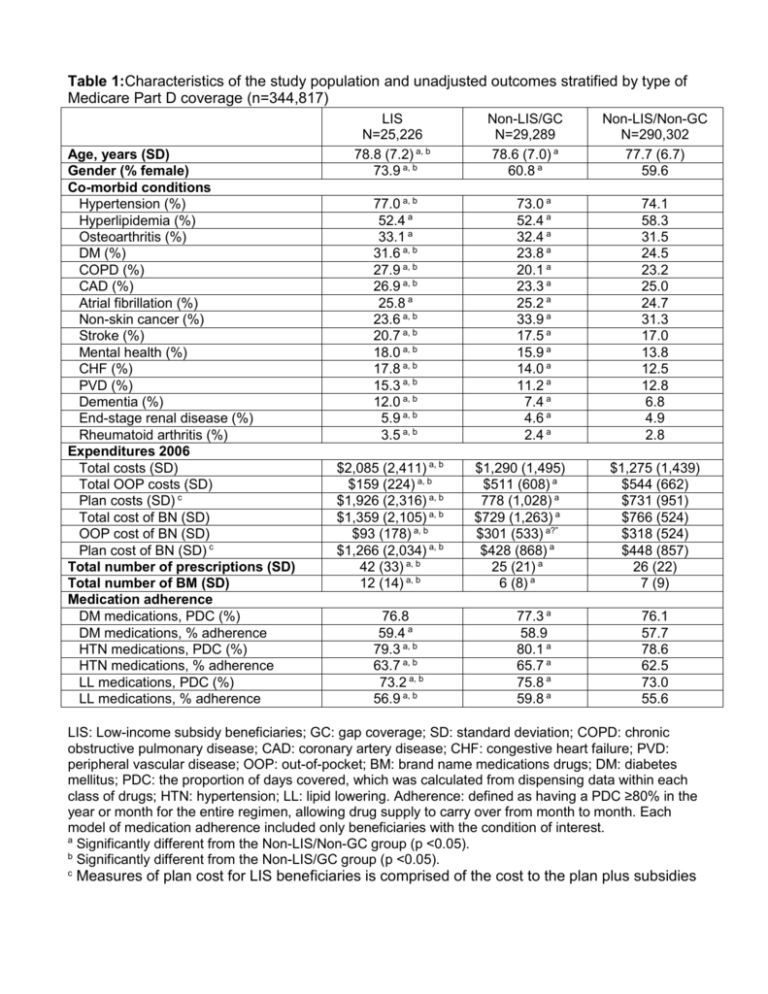
Table 1:Characteristics of the study population and unadjusted outcomes stratified by type of Medicare Part D coverage (n=344,817) Age, years (SD) Gender (% female) Co-morbid conditions Hypertension (%) Hyperlipidemia (%) Osteoarthritis (%) DM (%) COPD (%) CAD (%) Atrial fibrillation (%) Non-skin cancer (%) Stroke (%) Mental health (%) CHF (%) PVD (%) Dementia (%) End-stage renal disease (%) Rheumatoid arthritis (%) Expenditures 2006 Total costs (SD) Total OOP costs (SD) Plan costs (SD) c Total cost of BN (SD) OOP cost of BN (SD) Plan cost of BN (SD) c Total number of prescriptions (SD) Total number of BM (SD) Medication adherence DM medications, PDC (%) DM medications, % adherence HTN medications, PDC (%) HTN medications, % adherence LL medications, PDC (%) LL medications, % adherence LIS N=25,226 78.8 (7.2) a, b 73.9 a, b 77.0 a, b 52.4 a 33.1 a 31.6 a, b 27.9 a, b 26.9 a, b 25.8 a 23.6 a, b 20.7 a, b 18.0 a, b 17.8 a, b 15.3 a, b 12.0 a, b 5.9 a, b 3.5 a, b $2,085 (2,411) a, b $159 (224) a, b $1,926 (2,316) a, b $1,359 (2,105) a, b $93 (178) a, b $1,266 (2,034) a, b 42 (33) a, b 12 (14) a, b 76.8 59.4 a 79.3 a, b 63.7 a, b 73.2 a, b 56.9 a, b Non-LIS/GC N=29,289 78.6 (7.0) a 60.8 a 73.0 a 52.4 a 32.4 a 23.8 a 20.1 a 23.3 a 25.2 a 33.9 a 17.5 a 15.9 a 14.0 a 11.2 a 7.4 a 4.6 a 2.4 a $1,290 (1,495) $511 (608) a 778 (1,028) a $729 (1,263) a $301 (533) a?” $428 (868) a 25 (21) a 6 (8) a 77.3 a 58.9 80.1 a 65.7 a 75.8 a 59.8 a Non-LIS/Non-GC N=290,302 77.7 (6.7) 59.6 74.1 58.3 31.5 24.5 23.2 25.0 24.7 31.3 17.0 13.8 12.5 12.8 6.8 4.9 2.8 $1,275 (1,439) $544 (662) $731 (951) $766 (524) $318 (524) $448 (857) 26 (22) 7 (9) 76.1 57.7 78.6 62.5 73.0 55.6 LIS: Low-income subsidy beneficiaries; GC: gap coverage; SD: standard deviation; COPD: chronic obstructive pulmonary disease; CAD: coronary artery disease; CHF: congestive heart failure; PVD: peripheral vascular disease; OOP: out-of-pocket; BM: brand name medications drugs; DM: diabetes mellitus; PDC: the proportion of days covered, which was calculated from dispensing data within each class of drugs; HTN: hypertension; LL: lipid lowering. Adherence: defined as having a PDC ≥80% in the year or month for the entire regimen, allowing drug supply to carry over from month to month. Each model of medication adherence included only beneficiaries with the condition of interest. a Significantly different from the Non-LIS/Non-GC group (p <0.05). b Significantly different from the Non-LIS/GC group (p <0.05). c Measures of plan cost for LIS beneficiaries is comprised of the cost to the plan plus subsidies Table 2: Characteristics of patients in residential census tracts stratified by type of Medicare Part D coverage (n=344,817) Median household income (SD) Education level (%) Percentage of residents with < a HS education Percentage of residents with < a college degree Proportion of residents with linguistic isolation Race/Ethnicity (%) White Latino Other race African American Asian/Pacific Islander American Indian LIS N=25,226 $42,412 (19,206) a, b Non-LIS/GC N=29,289 $51,022 (19,878) a Non-LIS/Non-GC N=290,302 $51,459 (22,397) 25.1 a, b 74.3 a, b 8.1 a, b 16.4 a 65.3 a 5.3 a 17.8 66.8 5.5 72.6 a, b 29.4 a, b 15.4 a, b 7.9 a, b 5.7 a, b 2.4 a, b 80.7 a 20.2 a 10.5 a 3.9 a 6.9 a 2.1 a 80.3 19.8 9.9 5.0 6.1 2.0 HS: high school. a b Significantly different from the Non-LIS/Non-GC group (p <0.05). Significantly different from the Non-LIS/GC group (p <0.05). Table 3: Regression-adjusted estimates of expenditures, prescription drug use, and adherence to medications stratified by type of Medicare Part D coverage (n=344,817) LIS N=25,226 Non-LIS/GC N=29,289 Non-LIS/Non-GC N=290,302 $1,887 a, b (1,864-1,910) $148 a, b (146-150) $1,708 a, b (1,687-1,729) $1,360 a (1,344-1,375) $546 a (539-552) $822 a (811-833) $1,341 (1,336-1,347) $570 (567-572) $776 (772-780) $1,325 a, b (1,305-1,346) $96 a, b (94-98) $1,221 a, b (1,202-1,240) 27.6% a, b (27.2-28.1) $926 a (911-941) $374 a (368-381) $560 a (549-571) 17.4% a (17.0-17.8) $898 (893-903) $369 (367-371) $537 (533-540) 16.9% (16.8-17.0) 38.1 a, b (37.8-38.4) 10.7 a, b (10.5-10.8) 25.1 a (24.9-25.3) 6.4 a (6.3-6.5) 26.5 (26.4-26.5) 6.9 (6.87-6.92) 62.5% a, b (61.0-63.9) 65.6% a, b (64.9-66.3) 59.6% a, b (58.5-60.6) 57.7% (56.0-59.4) 64.2% a (63.5-64.9) 57.0% a (56.0-58.0) 57.4% (56.9-58.0) 62.4% (62.2-62.6) 55.6% (55.3-55.9) Expenditures Total expenditures OOP expenditures Plan expenditures c Expenditures on BM medications Total expenditures OOP expenditures Plan expenditures c Expenditures exceeding the gap threshold Prescriptions Total number of prescriptions Total number of B prescriptions Adherence to medications DM drug adherence HTN drug adherence LL drug adherence LIS: low-income subsidy beneficiaries; GC: gap coverage; SD: standard deviation; OOP: outof-pocket; BN: brand name; HTN: hypertension; PDC, proportion of days covered, which was calculated from dispensing data within each class of drugs; LL: lipid-lowering. Adherence: defined as having a PDC ≥80% in the year or month for the entire regimen, allowing drug supply to carry over from month to month. Each model of medication adherence included only beneficiaries with the condition of interest. Estimates were adjusted for the individual beneficiary characteristics and clinical co-morbidities listed in Table 1 and for the residential census characteristics listed in Table 2. (95% Confidence Interval). a Significantly different from the Non-LIS/Non-GC group (p <0.05). b Significantly different from the Non-LIS/GC group (p <0.05). c Measures of plan cost for LIS beneficiaries is comprised of the cost to the plan plus subsidies
