Atmospheric Dynamics
advertisement
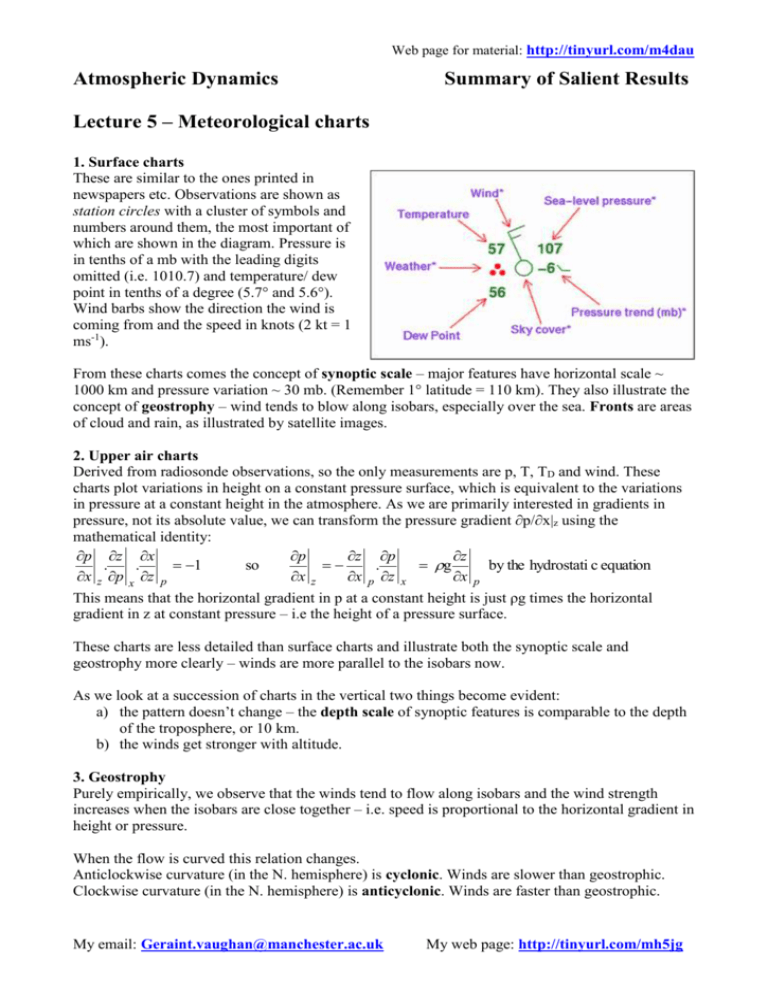
Web page for material: http://tinyurl.com/m4dau Atmospheric Dynamics Summary of Salient Results Lecture 5 – Meteorological charts 1. Surface charts These are similar to the ones printed in newspapers etc. Observations are shown as station circles with a cluster of symbols and numbers around them, the most important of which are shown in the diagram. Pressure is in tenths of a mb with the leading digits omitted (i.e. 1010.7) and temperature/ dew point in tenths of a degree (5.7° and 5.6°). Wind barbs show the direction the wind is coming from and the speed in knots (2 kt = 1 ms-1). From these charts comes the concept of synoptic scale – major features have horizontal scale ~ 1000 km and pressure variation ~ 30 mb. (Remember 1° latitude = 110 km). They also illustrate the concept of geostrophy – wind tends to blow along isobars, especially over the sea. Fronts are areas of cloud and rain, as illustrated by satellite images. 2. Upper air charts Derived from radiosonde observations, so the only measurements are p, T, TD and wind. These charts plot variations in height on a constant pressure surface, which is equivalent to the variations in pressure at a constant height in the atmosphere. As we are primarily interested in gradients in pressure, not its absolute value, we can transform the pressure gradient ∂p/∂x|z using the mathematical identity: p z x p z p z . . 1 so . g by the hydrostati c equation x z p x z p x z x p z x x p This means that the horizontal gradient in p at a constant height is just ρg times the horizontal gradient in z at constant pressure – i.e the height of a pressure surface. These charts are less detailed than surface charts and illustrate both the synoptic scale and geostrophy more clearly – winds are more parallel to the isobars now. As we look at a succession of charts in the vertical two things become evident: a) the pattern doesn’t change – the depth scale of synoptic features is comparable to the depth of the troposphere, or 10 km. b) the winds get stronger with altitude. 3. Geostrophy Purely empirically, we observe that the winds tend to flow along isobars and the wind strength increases when the isobars are close together – i.e. speed is proportional to the horizontal gradient in height or pressure. When the flow is curved this relation changes. Anticlockwise curvature (in the N. hemisphere) is cyclonic. Winds are slower than geostrophic. Clockwise curvature (in the N. hemisphere) is anticyclonic. Winds are faster than geostrophic. My email: Geraint.vaughan@manchester.ac.uk My web page: http://tinyurl.com/mh5jg

