Online data supplement
advertisement
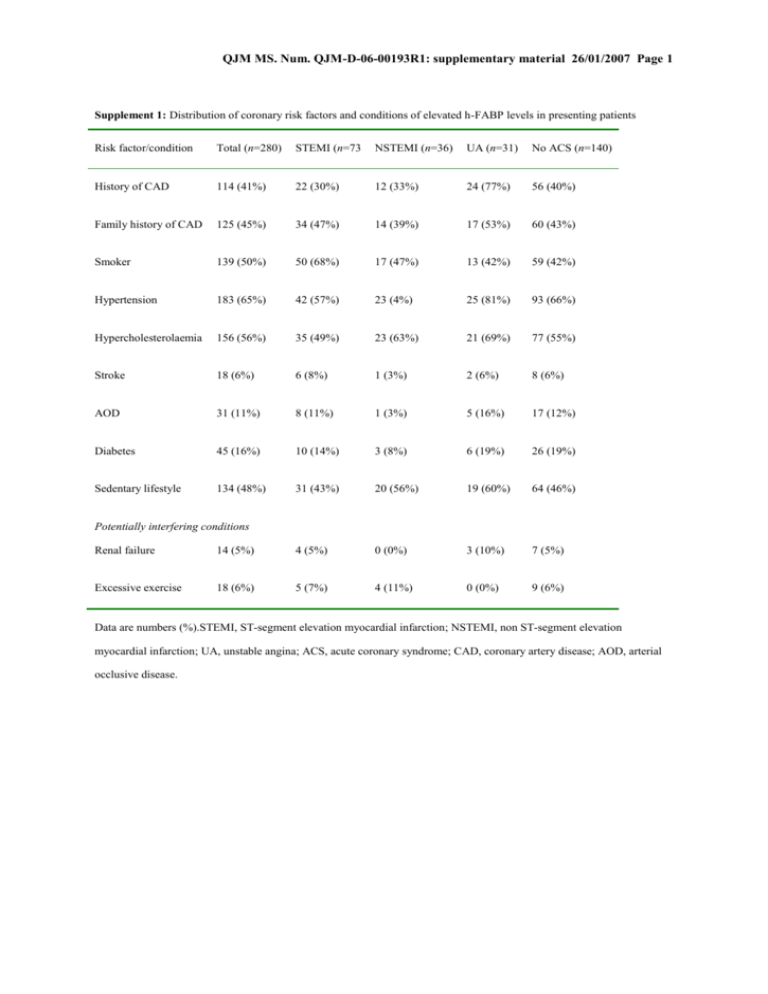
QJM MS. Num. QJM-D-06-00193R1: supplementary material 26/01/2007 Page 1 Supplement 1: Distribution of coronary risk factors and conditions of elevated h-FABP levels in presenting patients Risk factor/condition Total (n=280) STEMI (n=73 NSTEMI (n=36) UA (n=31) No ACS (n=140) History of CAD 114 (41%) 22 (30%) 12 (33%) 24 (77%) 56 (40%) Family history of CAD 125 (45%) 34 (47%) 14 (39%) 17 (53%) 60 (43%) Smoker 139 (50%) 50 (68%) 17 (47%) 13 (42%) 59 (42%) Hypertension 183 (65%) 42 (57%) 23 (4%) 25 (81%) 93 (66%) Hypercholesterolaemia 156 (56%) 35 (49%) 23 (63%) 21 (69%) 77 (55%) Stroke 18 (6%) 6 (8%) 1 (3%) 2 (6%) 8 (6%) AOD 31 (11%) 8 (11%) 1 (3%) 5 (16%) 17 (12%) Diabetes 45 (16%) 10 (14%) 3 (8%) 6 (19%) 26 (19%) Sedentary lifestyle 134 (48%) 31 (43%) 20 (56%) 19 (60%) 64 (46%) Potentially interfering conditions Renal failure 14 (5%) 4 (5%) 0 (0%) 3 (10%) 7 (5%) Excessive exercise 18 (6%) 5 (7%) 4 (11%) 0 (0%) 9 (6%) Data are numbers (%).STEMI, ST-segment elevation myocardial infarction; NSTEMI, non ST-segment elevation myocardial infarction; UA, unstable angina; ACS, acute coronary syndrome; CAD, coronary artery disease; AOD, arterial occlusive disease. QJM MS. Num. QJM-D-06-00193R1: supplementary material 26/01/2007 Page 2 Supplement 2: Subgroup analysis of all patients presenting to hospital for the secondary endpoint ACS n ACS Sensitivity Specificity LR (+) LR (–) prevalence (%) Overall 280 50% 58.6 (49.9–66.8) 72.9 (64.7–80.0) 2.16 (1.59–2.93) 0.569 (0.456–0.712) <2 h 107 58% 56.5 (43.3–69.0) 75.6 (60.5–87.1) 2.31 (1.32–4.04) 0.576 (0.415–0.801) 2–6 h 105 48% 50.0 (35.5–64.5) 70.9 (57.1–82.4) 1.72 (1.05–2.83) 0.705 (0.510–0.976) >6 h 68 41% 78.6 (59.0–91.7) 72.5 (56.1–85.4) 2.86 (1.67–4.90) 0.296 (0.142–0.616) ≥55 years 164 56% 65.2 (54.6–74.9) 58.3 46.1–69.8) 1.57 (1.15–2.14) 0.596 (0.424–0.839) <55 years 116 41% 45.8 (31.4–60.8) 88.2 (78.1–94.8) 3.90 (1.90–8.00 0.614 (0.467–0.808) Female 67 36% 58.3 (36.6–77.9) 65.1 (49.1–79.0) 1.67 (0.984–2.84) 0.640 (0.380–1.08) Male 213 54% 58.6 (49.1–67.7) 76.3 (66.6–84.3) 2.47 (1.68–3.65) 0.542 (0.425–0.692) No 254 50% 57.5 (48.4–66.2) 75.6 (67.2–82.8) 2.35 (1.68–3.31) 0.563 (0.449–0.704) Yes 26 50% 69.2 (38.6–90.9) 46.2 (19.2–74.9) 1.29 (0.692–2.39) 0.667 (0.244–1.82) No 262 50% 58.0 (49.1–66.6) 71.8 (63.2–79.3) 2.05 (1.51–2.80) 0.585 (0.466–0.735) Yes 18 50% 66.7 (29.9–92.5) 88.9 (51.8–99.7) 6.00 (0.893–40.3) 0.375 (0.145–0.972) Symptom start Age Gender CRF Exercise Risk stratification* <4 risk factors 200 51% 60.8 (50.6–70.3) 74.5 (64.7–82.8) 2.38 (1.64–3.46) 0.526 (0.403–0.688) ≥4 risk factors 80 48% 52.6 (35.8–69.0) 69.0 (52.9–82.0) 1.70 (0.988–2.93) 0.686 (0.464–1.01) Data are numbers, percentages, or means (95%CI), as appropriate. LR, likelihood ratio. ACS, acute coronary syndrome; CRF, chronic renal failure. *High risk group: patients were considered to be at high risk when presenting with ≥4 of the QJM MS. Num. QJM-D-06-00193R1: supplementary material 26/01/2007 Page 3 following risk factors: Past medical history of CAD, family history of CAD, smoker, hypertension, diabetes, hypercholesterolaemia QJM MS. Num. QJM-D-06-00193R1: supplementary material 26/01/2007 Page 4 Supplement 3: Cross table of h-FABP test results vs. diagnosis for the secondary endpoint ACS h-FABP (+) h-FABP (–) Inconclusive Missing Total ACS present 69 47 24 (13+/11–) 0 140 ACS absent 30 95 15 (8+/7–) 0 140 Total 99 142 39 (21+/18–) 0 280 At presentation Four hours after presentation ACS present 97 25 16 (6+/10–) 2 140 ACS absent 25 95 17 (9+/8–) 3 140 Total 122 120 33 (15+/18–) 5 280 ACS, acute coronary syndrome.

