Supplement 3: Prediction Models Table 4 based on Bösner et al.30
advertisement
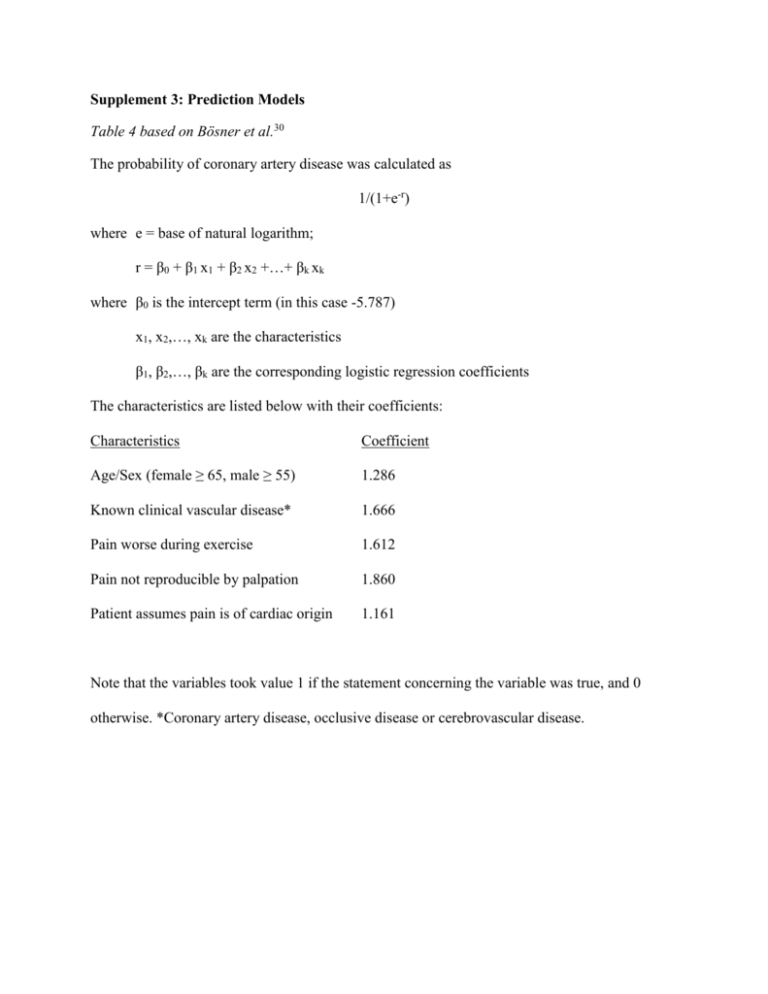
Supplement 3: Prediction Models Table 4 based on Bösner et al.30 The probability of coronary artery disease was calculated as 1/(1+e-r) where e = base of natural logarithm; r = β0 + β1 x1 + β2 x2 +…+ βk xk where β0 is the intercept term (in this case -5.787) x1, x2,…, xk are the characteristics β1, β2,…, βk are the corresponding logistic regression coefficients The characteristics are listed below with their coefficients: Characteristics Coefficient Age/Sex (female ≥ 65, male ≥ 55) 1.286 Known clinical vascular disease* 1.666 Pain worse during exercise 1.612 Pain not reproducible by palpation 1.860 Patient assumes pain is of cardiac origin 1.161 Note that the variables took value 1 if the statement concerning the variable was true, and 0 otherwise. *Coronary artery disease, occlusive disease or cerebrovascular disease. Table 5 based on Björk et al.33 The probability of ACS was calculated as A/(1+A) where A = estimated odds of ACS = α0 * α1(age-40) * α2 *…* αk where α0 is the baseline odds (in this case 0.0066) α1 is the odds ratio corresponding to the age variable (in this case 1.036) α2,…, αk are the odds ratios for the other risk factors of the patient The risk factors are listed below with their odds ratios: Risk factors Odds ratio Age (no. of years above 40) 1.036 Hypertension 2.3 Angina pectoris ≤ 1 month 2.8 Congestive heart failure 0.55 Previous myocardial infarction Yes, ≤ 6 months 3.4 Yes, > 6 months 1.9 No 1.0 Previous CABG 0.28 Chest discomfort at presentation 1.8 Symptom duration 0-6 h 4.6 7-12 h 3.7 > 12 h 1.0 ECG expert assessment ACS and TMI 97 ACS but not TMI 11 Probably ACS 5.8 No signs of ACS 1.0 ACS: acute coronary syndrome. TMI: transmural ischaemia For example, the probability of CAD for a a 72 year old patient reporting chest pain lasting eight hours, with medical history of coronary artery bypass graft, previous MI more than 6 months ago, angina pectoris in the previous month and an ECG showing ACS and TMI would be calculated as follows: 0.0066 x 1.036(72-40) x 3.7 x 0.28 x 1.9 x 2.8 x 97 = 10.9420 Probability= 10.9420/(1+10.9420) = 0.92 (2 d.p.) Table 6 based on Genders et al. 31 The probability of coronary artery disease was calculated as 1/(1+e-r) where e = base of natural logarithm; r = β0 + β1 x1 + β2 x2 +…+ βk xk where β0 is the intercept term (in this case -7.539) x1, x2,…, xk are the characteristics β1, β2,…, βk are the corresponding logistic regression coefficients The characteristics are listed below with their coefficients: Characteristics Coefficient Age 0.062 Sex (1 = male, 0 = female) 1.332 Atypical chest pain (1 if present) 0.633 Typical chest pain (1 if present) 1.998 Diabetes (1 if present) 0.828 Hypertension (1 if present) 0.338 Dyslipidaemia (1 if present) 0.422 Smoking (1 if smoking, 0 if non-smoking) 0.461 Diabetes * Typical chest pain (interaction) -0.402 Note that the clinical model also included a variable for ‘setting’ to account for differences in patient selection across datasets, but when applying the model for new patients this setting variable is set to zero (low prevalence setting). The model also included a random effect for hospital, but predicted probabilities were calculated using the fixed part of the model only.
