Blood alcohol levels in fatal crashes
advertisement
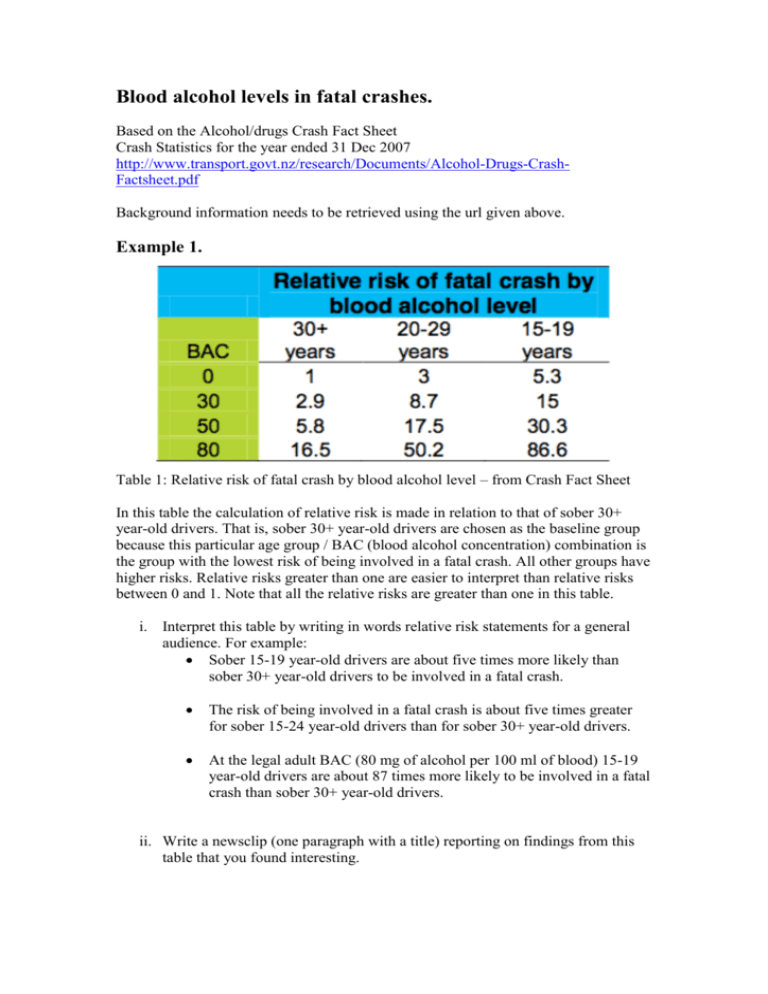
Blood alcohol levels in fatal crashes. Based on the Alcohol/drugs Crash Fact Sheet Crash Statistics for the year ended 31 Dec 2007 http://www.transport.govt.nz/research/Documents/Alcohol-Drugs-CrashFactsheet.pdf Background information needs to be retrieved using the url given above. Example 1. Table 1: Relative risk of fatal crash by blood alcohol level – from Crash Fact Sheet In this table the calculation of relative risk is made in relation to that of sober 30+ year-old drivers. That is, sober 30+ year-old drivers are chosen as the baseline group because this particular age group / BAC (blood alcohol concentration) combination is the group with the lowest risk of being involved in a fatal crash. All other groups have higher risks. Relative risks greater than one are easier to interpret than relative risks between 0 and 1. Note that all the relative risks are greater than one in this table. i. Interpret this table by writing in words relative risk statements for a general audience. For example: Sober 15-19 year-old drivers are about five times more likely than sober 30+ year-old drivers to be involved in a fatal crash. The risk of being involved in a fatal crash is about five times greater for sober 15-24 year-old drivers than for sober 30+ year-old drivers. At the legal adult BAC (80 mg of alcohol per 100 ml of blood) 15-19 year-old drivers are about 87 times more likely to be involved in a fatal crash than sober 30+ year-old drivers. ii. Write a newsclip (one paragraph with a title) reporting on findings from this table that you found interesting. Ages of victims of fatal crashes in New Zealand Example 2. Age group under 15 15-24 25-34 35-44 45-54 55-64 65-74 75+ Total No. of fatalities 18 93 47 31 35 29 17 30 300 Risk for each age group Relative risk with 65-74 age group as baseline 0.31 5.47 1.00 Table 2: Ages of victims of fatal crashes for the 12 months to the end of October 2009. i. Given that a person was a victim of a fatal crash for the12 months to the end of October 2009, what is the risk for a 15-24 year-old? Complete table. What do you notice? ii. The 65-74 year-old age group has the lowest number of fatalities so use this as the baseline group. Calculate the relative risks, that is, the risk for each age group relative to the 65-74 year-old age group. Complete table. What do you notice? iii. Interpret this table by writing in words relative risk statements for a general audience. For example: 15-24 year-olds are about five times more likely to be victims of fatal crashes than 65-74 year-olds. iv. Write a newsclip (one paragraph with a title) reporting on findings from the table that you found interesting. Victims of fatal crashes aged between 15 and 74 Example 3. (This is example 2 with the age groups re-categorised and the under 15 and 75+ age groups removed. Note the total number of fatalities is changed accordingly.) Age group 15-34 35-54 55-74 Total No. of fatalities Risk for each age group Relative risk with 55-74 age group as baseline 140 66 46 252 Table 3: Victims of fatal crashes aged between 15 and 74 for the 12 months to the end of October 2009. Do similar questions to Example 2. Discussion Points: 1. How do you interpret a relative risk of one? 2. What is the absolute risk for 15-24 year-olds being victims of fatal crashes? (Consider the number of 15-24 year-olds in the New Zealand population in 2009.)
