Muscle Fatigue
-
Purpose
Background Information
Equipment
Software Set-up
Experimental Procedure
Data Analysis
Conclusions and Extensions
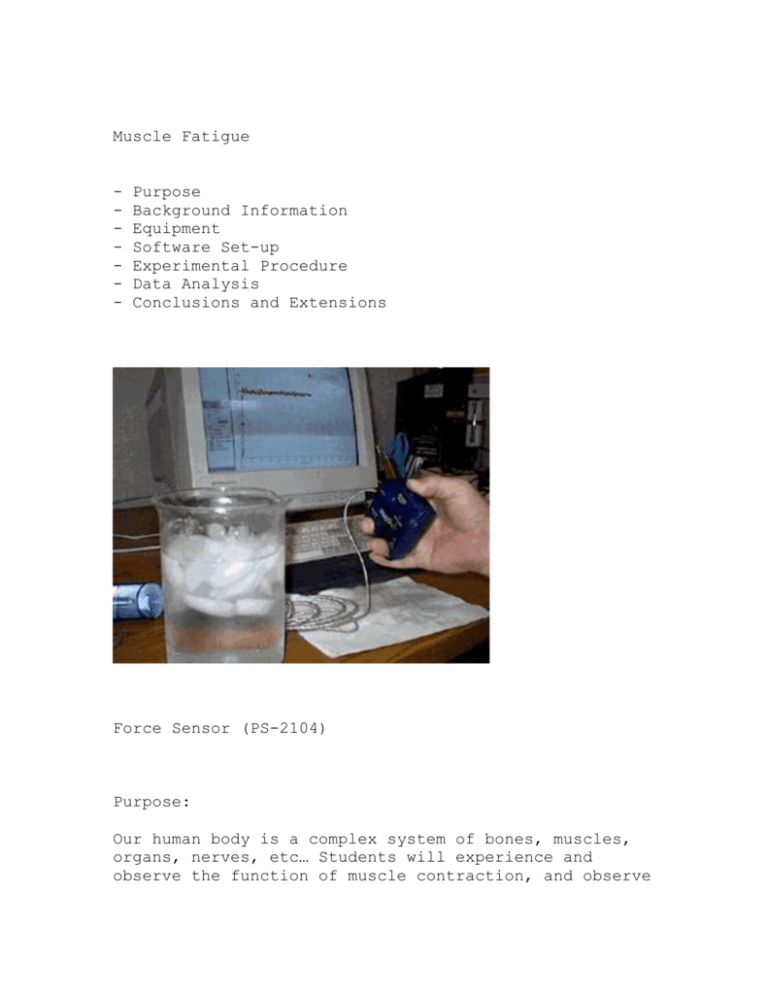
Force Sensor (PS-2104)
Purpose:
Our human body is a complex system of bones, muscles,
organs, nerves, etc… Students will experience and
observe the function of muscle contraction, and observe
how temperature and fatigue impact muscle function and
performance.
Background Information:
Bones and organs are moved by contractile muscle
tissue, of which there are three types: skeletal,
smooth, and cardiac. Skeletal muscles, those
responsible for moving parts of the body that are under
voluntary control, are made up of muscle fibers. Each
muscle fiber is an elongated, multinucleated cell
crossed by dark and light striations, and the fibers
are grouped into bundles called fascicles. Generally,
the muscle fibers span the length of the muscle and are
woven into connective tissues like tendons at the end
of the muscle. The tendons attach the muscle to the
bone, allowing it to function as a biological lever
that can exert force on the bone it attaches to. The
more fibers a muscle has, the more powerful the muscle
is: for example, the quadriceps has a huge number of
fibers, so it is one of the most powerful muscles in
the body.
Every skeletal muscle is supplied with at least one
nerve, one artery, and one vein. This is to ensure that
every muscle can receive incoming nerve impulses while
being fueled by fresh blood from the arteries. The
veins are needed to export deoxygenated blood
containing metabolic wastes and other byproducts.
Active muscles require energy, and therefore require a
continuous supply of oxygen and nutrients. For fuel,
muscles rely on glucose form the bloodstream, glycogen
stored in the muscle fibers, or fat molecules during
vigorous, prolonged exercise. When energy availability
fails to keep pace with the demands being placed on the
muscle, the muscle will lose its physiological abillity
to contract in a controlled fashion due to ATP
depletion. Even though the muscle may still receive
nerve stimulation to move, muscle fatigue sets in.
Back to top
Equipment:
For each lab group:
*
Force Sensor:
PASPORT (PS-2104)
|
ScienceWorkshop (CI6746)
* Computer Interface:
PASPORT: Xplorer GLX (PS-2002) | Xplorer
(PS-2000) | USB Link (PS-2100A) | PowerLink (PS2001)
ScienceWorkshop: 500 Interface (CI-6400)
* Container of cold water
* Ice
Back to top
Software Setup:
1.
Click on one of the links below to download a
pre-configured DataStudio file for this force
experiment, and then open the file.
PASPORT users: Windows (.zip file) or Macintosh
(.sit file)
ScienceWorkshop 500 users: Windows (.zip file) or
Macintosh (.sit file)
When the file is opened, you should see a graph
display of Force vs. Time, as well as a digits display
of force.
2.
Connect the Force Sensor to an Xplorer or USB
link (PASPORT users), or plug the sensor into the 500
Interface (ScienceWorkshop 500 users).
If you are using the ScienceWorkshop 500
Interface, be sure the sensor is associated correctly
in the Experiment Setup window when you open the
DataStudio file.
3.
Be sure the rubber bumper (included with the
sensor) is screwed into the sensor.
Back to top
Experimental Procedure:
Data Recording:
1. Place the ice into the container of cold water,
and let stand until the water temperature is about 4
degrees Celsius.
2. Grip the Force Sensor and place your thumb on the
rubber bumper.
3. Click the Start button ( ) to begin collecting
data.
4. Begin squeezing the Force Sensor until the
DataStudio graph display reads 40N or above.
5. Continue to hold the Force Sensor at or above 40N
as long as possible.
6. Click the Stop button ( ) once the display begins
to drop below 40N.
7. Submerse the same hand into the container of ice
water for 30 seconds or more.
8. Repeat steps 2-6.
Data Analysis:
1. Examine the graph display to view your data,
using the Scale to Fit button ( ) in the Graph toolbar
to resize the axes.
2. Determine the length of time for each endurance
test.
3. Examine how steady the graph of Force vs. Time is
-- was the test subject able to exert a fairly constant
force? Or were there oscillations in the graph?
Back to top
Conclusions and Extensions:
1. Which of the two endurance tests were longer in
length of time?
2. What factors may have caused different results?
3. What effect did the ice water have on the action
of the student’s hand muscles? Why?
4. Discuss how this experiment relates to the
experience of drowning victims who succumb in very cold
water as opposed to warmer waters.
Back to top
Back to Biology Experiments Home Page
10101 Foothills Blvd.
Roseville, CA 95747
USA 1-800-772-8700
1-916-786-3800
E-mail PASCO Web Team ISO 9001:2000
Certified
© Copyright 1996-2007
All rights reserved
Privacy Statement


