SSG10 230
advertisement
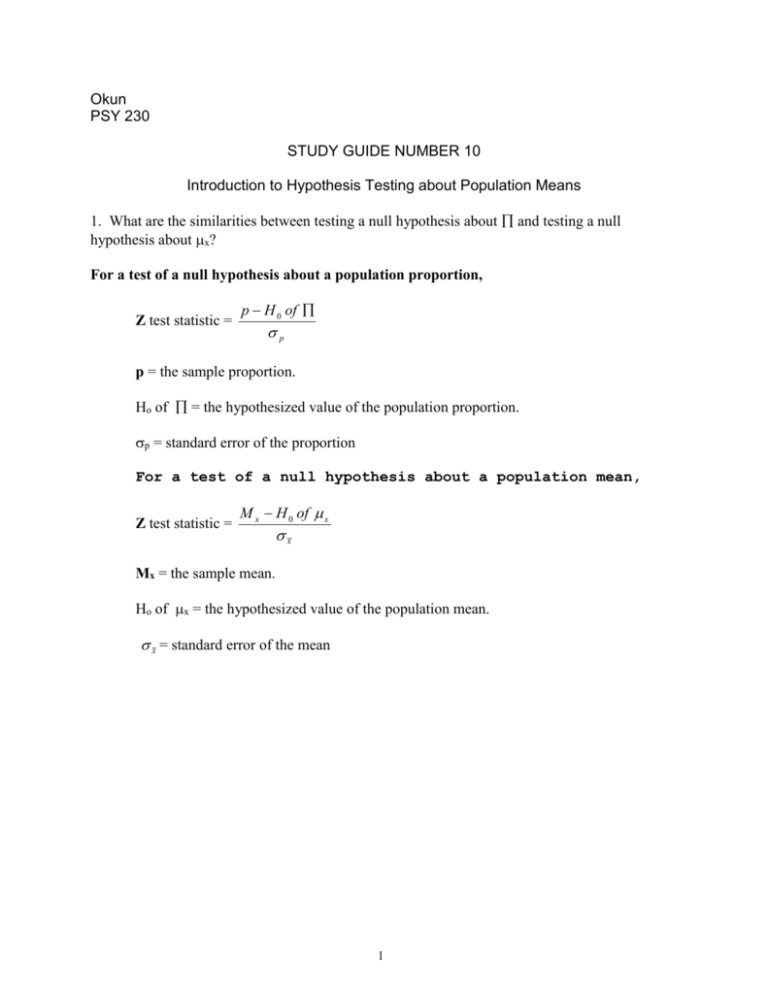
Okun PSY 230 STUDY GUIDE NUMBER 10 Introduction to Hypothesis Testing about Population Means 1. What are the similarities between testing a null hypothesis about and testing a null hypothesis about x? For a test of a null hypothesis about a population proportion, Z test statistic = p H 0 of p p = the sample proportion. Ho of = the hypothesized value of the population proportion. p = standard error of the proportion For a test of a null hypothesis about a population mean, Z test statistic = M x H 0 of x x Mx = the sample mean. Ho of x = the hypothesized value of the population mean. x = standard error of the mean 1 2. How can the distribution of sample means be constructed? Consider a miniature population of 4 scores: 2, 4, 6, and 8. N = 4, x = 5, and x = 2.24. Suppose we draw all possible random samples of 2 scores (n = 2) with replacement from this population. What will the sample means look like? Sample First Score Second Score Mx ____________________________________________ 1 2 2 2 2 2 4 3 3 2 6 4 4 2 8 5 5 4 2 3 6 4 4 4 7 4 6 5 8 4 8 6 9 6 2 4 10 6 4 5 11 6 6 6 12 6 8 7 13 8 2 5 14 8 4 6 15 8 6 7 16 8 8 8 ____________________________________________ 3. Which symbols are used to designate the (a) the mean of the distribution of sample means; and (b) the standard deviation of the distribution of sample means? The mean of the distribution of sample means is designated x . The standard deviation of the distribution of sample means is designated x . The standard deviation of the distribution of sample means is also known as the standard error of the mean. 2 4. What are the three principles of the central limits theorem (CLT)? CLT Principle #1: x = x Since x = 5, x 5 CLT Principle #2: x x n Since x 2.24 and n 2, x 2.24 where n = sample size and x = population SD 2 2.24 1.4142 1.58 CLT Principle #3: The distribution of sample means will be normally distributed if (a) the population of individual scores is normally distributed; or (b) the population of individual scores is skewed but the sample size associated with each sample is equal to or greater than 30. 5. How can we interpret the meaning of x ? The standard error of the mean represents an approximate measure of how far, on average, sample means are located from a population mean. Researchers like the standard error of the mean to be as small as possible because it is an index of the amount of sampling error. 6. What factors affect the size of the standard error of the mean? If a researcher wants a small standard error of the mean, what should she do? There is a direct relation between x and x There is an inverse relation between n and x 3 7. How can the 7 steps of hypothesis testing be applied to testing null hypotheses about x when x is known? 1-State the hypotheses. 2-Specify a probability value for making a decision about the null hypothesis 3-Select an appropriate test statistic 4-Determine the critical value of Z 5-Determine information available and collect data 6-Compute the value of the test statistic 7-Draw a conclusion regarding the hypotheses 4 The t-test for the Hypothesis about One Population Mean 8. Which piece of information needed to use the Z test statistic is usually unavailable? How is this piece of information usually obtained? How consequence does this have for the distribution of sample means that we use? 9. Which sampling distribution do we use when x is not known? How is the variability in this sampling distribution affected by n? 10. In what ways are the Z and t test statistic similar and in what ways are they different? Z M x H 0 of x x t M x H 0 of x Sx where where x x n Sx Sx n 11. What does the concept, degrees of freedom (df), refer to? How many dfs are there for the 1-sample t test? degrees of freedom (df) refers to the number of observations whose values are free to vary. For the 1-sample t test, df = n-1 Sx X i M x 2 n 1 SS n 1 SS df 5 12. For the Z test, which factor determines the critical value? For the t test, which factors determine the critical value? As degrees of freedom increase, what happens to (a) the critical value for t; and (b) the discrepancy between the standard normal curve and the t distribution? Critical Values as a Function of Alpha, n, and Type of Test Type of Test Z t Alpha = .05 Sample Size 6 21 101 /1.96/ /1.96/ /1.96/ /2.57/ /2.09/ /1.98/ Alpha = .01 Sample Size 6 21 101 /2.58/ /2.58/ /2.58/ /4.03/ /2.85/ /2.63/ 6 7 13. What are the assumptions of the 1-sample t test? 14. How can we test the null hypothesis that µx equals a specific value using the 1-sample t test from raw data? Miles Per Gallon on the Open Road X X-Mx (X- Mx)2 40 -3 9 44 +1 1 46 +3 9 41 -2 4 43 0 0 44 +1 1 __________________ 258 0 24 When working with raw data, we must first compute Mx and Sx M x 258 6 43 S x 2.19 S x SS n 1 24 5 4.8 2.19 6 2.19 2.45 0.89 t M x H 0 of x Sx t 43 45 2.25 .89 8 15. How can we test the null hypothesis that µx equals a specific value using the 1-sample t test from summary data? When working with summary data, we will be given the sample mean, the sample standard deviation, and n. Reading Enrichment Program: M x 6.4; S x 1.2; and n 51 We must still compute S x 1.2 t M x H 0 of x Sx t 6.4 6.0 2.38 .168 51 1.2 7.14 0.168 9


