Supplementary material
advertisement
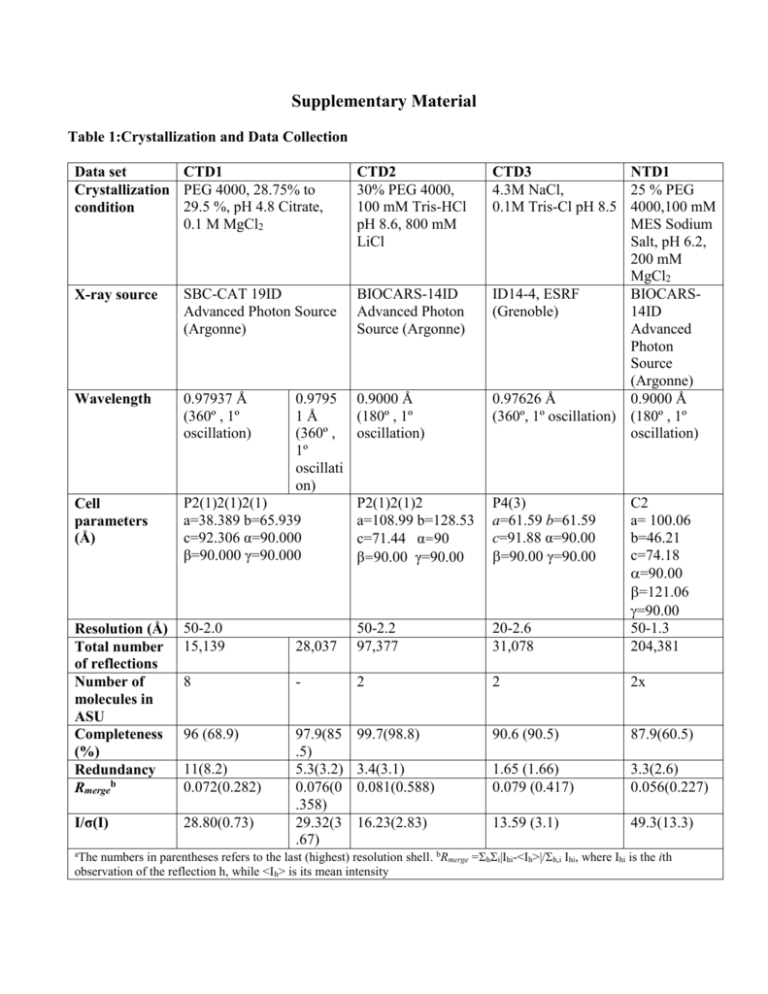
Supplementary Material Table 1:Crystallization and Data Collection Data set CTD1 Crystallization PEG 4000, 28.75% to 29.5 %, pH 4.8 Citrate, condition 0.1 M MgCl2 X-ray source SBC-CAT 19ID Advanced Photon Source (Argonne) Wavelength 0.97937 Å (360º , 1º oscillation) CTD2 30% PEG 4000, 100 mM Tris-HCl pH 8.6, 800 mM LiCl BIOCARS-14ID Advanced Photon Source (Argonne) 0.9795 0.9000 Å 1Å (180º , 1º (360º , oscillation) 1º oscillati on) P2(1)2(1)2(1) P2(1)2(1)2 a=38.389 b=65.939 a=108.99 b=128.53 c=92.306 α=90.000 c=71.44 α=90 β=90.000 γ=90.000 β=90.00 γ=90.00 CTD3 NTD1 4.3M NaCl, 25 % PEG 0.1M Tris-Cl pH 8.5 4000,100 mM MES Sodium Salt, pH 6.2, 200 mM MgCl2 ID14-4, ESRF BIOCARS(Grenoble) 14ID Advanced Photon Source (Argonne) 0.97626 Å 0.9000 Å (360º, 1º oscillation) (180º , 1º oscillation) Resolution (Å) Total number of reflections Number of molecules in ASU Completeness (%) Redundancy Rmergeb 50-2.0 15,139 28,037 50-2.2 97,377 20-2.6 31,078 C2 a= 100.06 b=46.21 c=74.18 =90.00 =121.06 =90.00 50-1.3 204,381 8 - 2 2 2x 96 (68.9) 99.7(98.8) 90.6 (90.5) 87.9(60.5) 3.4(3.1) 0.081(0.588) 1.65 (1.66) 0.079 (0.417) 3.3(2.6) 0.056(0.227) I/σ(I) 28.80(0.73) 97.9(85 .5) 5.3(3.2) 0.076(0 .358) 29.32(3 .67) 16.23(2.83) 13.59 (3.1) 49.3(13.3) Cell parameters (Å) 11(8.2) 0.072(0.282) P4(3) a=61.59 b=61.59 c=91.88 α=90.00 =90.00 γ=90.00 The numbers in parentheses refers to the last (highest) resolution shell. bRmerge =hi|Ihi-<Ih>|/h,i Ihi, where Ihi is the ith observation of the reflection h, while <Ih> is its mean intensity a Table 2: Refinement Statistics PDB CTD1 PDB CTD2 PDB CTD3 48-2.2 48,564 0.236 0.291 0.006 20-2.6 8,941 Rfactor§ Rfree# Mean Bond length deviation 50-2.0 15,110 0.238 0.269 0.005 0.204 0.256 0.009 PDB NTD1 50-1.3 60,751 0.210 0.250 0.008 Mean Bond angle deviation 1.305 1.318 1.176 1.235 94.2 91.6 89.8 88.6 5.8 7.6 10.2 10.4 - 0.6 - 0.5 - 0.2 - 0.5 x x 0.05 x Resolution Range (Å) Number of reflections Ramachandran statistics Residues in most favored regions (%) Residues in additional allowed regions (%) Residues in generously allowed regions (%) Residues in disallowed (poor density) regions (%) Overall G factor* § Rfactor = ||Fobs| - |Fcalc|| / |Fobs|. # Rfree# was calculated with 10% of reflections excluded from the whole refinement procedure. **G factor is the overall measure of structure quality from PROCHECK (44). Structure-sequence relationship in CTD. The amino acid sequence of IBV-CTD (Gray strain) is shown with conserved residues indicated in red and residues that are different in the Beaudette strain indicated above the corresponding residue in the sequence. The predicted secondary structure for SARS C-terminal domain (249-380) is superimposed on observed secondary structure for IBV-CTD shown in red helices green strands and blue loop regions. The residues involved in the dimer-dimer interactions are shaded with purple boxes for type S interaction (pH 4.5 and 8.5, CTD1 and CTD2 crystals), underlined with dark blue lines for type L interactions (pH 8.5, CTD2 crystals), and red lines for type F interaction (in CTD3 crystals). The surface accessibility is indicated by a bar at the bottom following a color scheme: totally accessible in white) to buried in dark blue. Experimental B-factors of individual residues are indicated on a scale from low (“b” text) to high (“B” text)
