ele12143-sup-0001-FigS1-S7_TableS1
advertisement

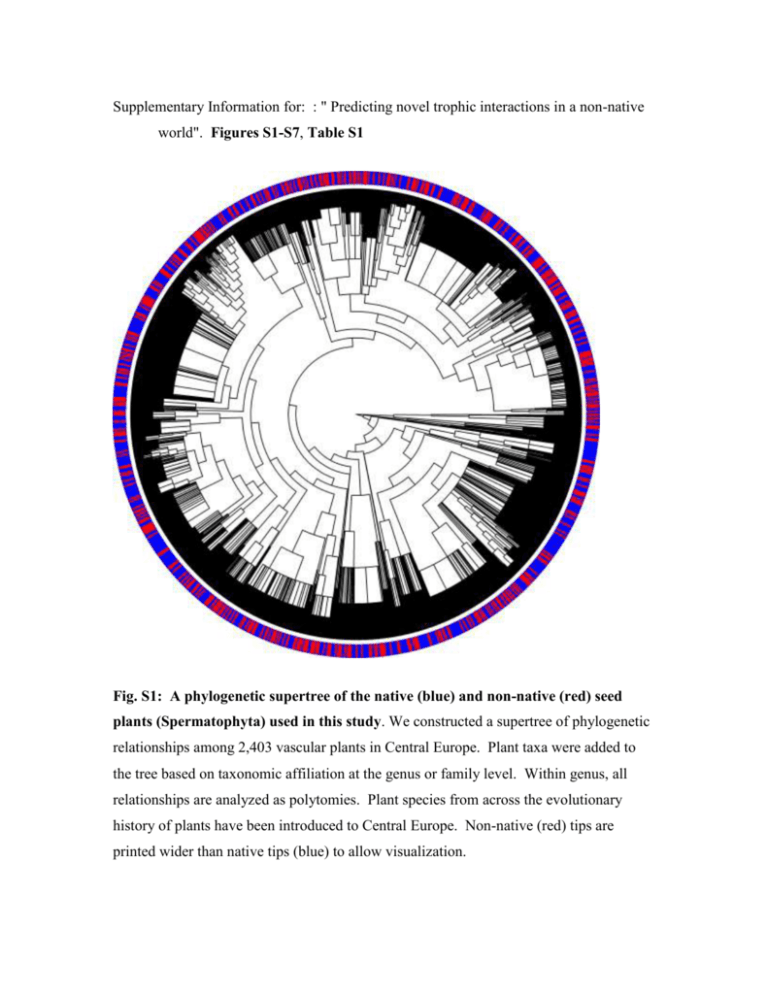
Supplementary Information for: : " Predicting novel trophic interactions in a non-native world". Figures S1-S7, Table S1 Fig. S1: A phylogenetic supertree of the native (blue) and non-native (red) seed plants (Spermatophyta) used in this study. We constructed a supertree of phylogenetic relationships among 2,403 vascular plants in Central Europe. Plant taxa were added to the tree based on taxonomic affiliation at the genus or family level. Within genus, all relationships are analyzed as polytomies. Plant species from across the evolutionary history of plants have been introduced to Central Europe. Non-native (red) tips are printed wider than native tips (blue) to allow visualization. Fig. S2: Sensitivity of parameter estimates to different numbers of data partitions. We partitioned the native plant-herbivore food web into 2-10 partitions (k 2 to 10), and calculated parameter estimates for each of the three factors in our full model. Bars represent the mean parameter estimate ± SE. Parameter estimates were insensitive to the respective partition level, and we subsequently used a partition-value k of five (5-fold partitioning). Fig. S3: Histograms of model scores for herbivore-plant interactions. A) Model scores for “non-hosts”, i.e., non-interacting non-native plants and herbivores. B) Model scores for actual “host” interactions between non-native plants and herbivores. The median model score for actual “host” interactions more than 2-fold higher than the median score for actual non-realized interactions. Fig. S4: ROC curves of simplified models. Lines show the model accuracy of the full novel interactions model incorporating host breadth and phylogenetic similarity (black; AUC= 0.930), a model incorporating only phylogenetic similarity (orange; AUC=0.914), and a model incorporating only host breadth (green; AUC=0.811). The true positive rate differed among models (Kolmogorov-Smirnov Tests; P<0.001). AUC - Area under the curve, which approaches one for a perfectly predictive model. number of host plant genera 50 40 30 20 10 0 0 10 20 30 40 50 60 70 number of host plant species Fig. S5: Host breadth based on plant species or genera. A scatterplot of the number of host plant species versus the number of host plant genera for all moth species in our study. Values are slightly jittered on both x- and y- axis (by 0.5). The line is a highly significant linear regression fit (p<0.0001). Because of the strong correlation between host plant species the definition of host breadth as the number of plant species consumed or plant genera did not affect the ability of the host-use model to predict novel hosts (species-based definition: AUC = 0.930, genus-based definition: AUC = 0.932). Fig. S6: Butterfly-only ROC curve. As butterfly-host associations are the bestdocumented herbivore-plant interactions, we restricted our herbivore dataset to only the 126 butterfly species and ran an analysis identical to that with the full dataset (Figure 1). The novel host predictions for the butterfly-only dataset were even better than for the full dataset, where we predicted all observed novel butterfly-plant interactions with only a 7% false-positive rate. The dashed line indicates the null expectations from an uninformative model, and the shaded, green area represents the increased predictive ability beyond that null model. Fig. S7: Native herbivores (A,B) feed on goldenrod (C), an invasive plant throughout Europe. A) adult moth of Eupithecia virgaureata (Foto H. Melzer, Lepiforum), B) larva of Eupithecia absinthiata (Foto F. Nantscheff, Lepiforum), and C) senescent goldenrod plants with seed heads (Solidago canadensis; Foto F. Altermatt). In Central Europe the geometrid moths Eupithecia virgaureata and E. absinthiata feed (among others) on various native mugworts and ragworts (Artemisia and Senecio sp.). Over the last decades they extended their diet onto invasive goldenrods (Solidago canadensis and S. gigantea) (25). We predicted this host-shift with a false-positive rate of only 0.08%. As the larvae of Eupithecia moths selectively feed on flowers and developing seeds, they may have a negative fitness effect on invasive Solidago sp. With our data we unfortunately cannot draw conclusions on temporal dynamics, and it is up to now unclear how effective host-switches are and how much they affect the non-native plants. However, the diet switch to a non-native plant is the first and probably most important step to use that plant more extensively. It is basically putting “the foot in the door”, which then may open up the possibility for ecological and evolutionary processes to use that novel plant more extensively. Table S1: Model parameters from data partitions (K=5) of the native plant-herbivore data (see STEP 1 in Fig. 1) as estimated using a generalized linear model where phylogenetic distance to a “native” (i.e., “predictor dataset”) plant, herbivore host breadth, and the interaction of these terms predicted the binomial response of host-use. The averaged model parameters were used in generating predictions of non-native host use (STEP 2 in Fig. 1). K Phylo- Herbivore Interaction: similarity to host Phylo Sim. x “Native” Plant breadth Host breadth 1 -8.59101 -0.01256 0.144882 2 -9.1036 -0.00619 0.115433 3 -9.11003 -0.00835 0.142009 4 -10.5968 -0.00000 0.09207 5 -9.02491 0.001372 0.10116 Ave -9.28528 -0.00515 0.119111 SE 0.341594 0.002601 0.010619


