Diffusion and Osmosis Lab Activity
advertisement
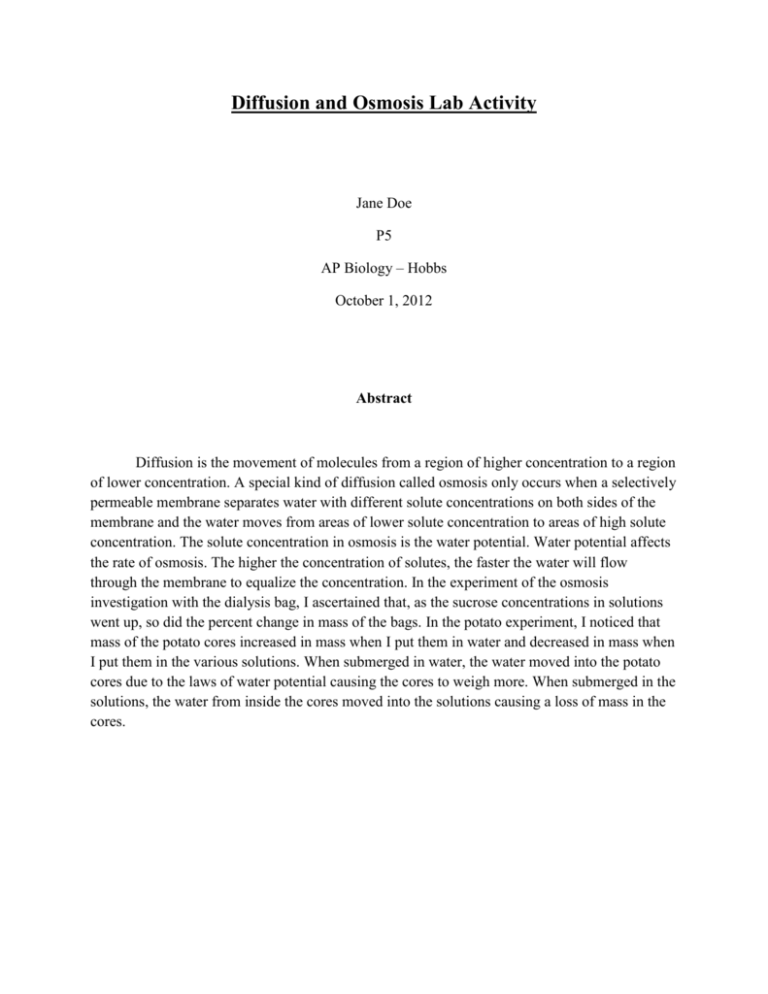
Diffusion and Osmosis Lab Activity Jane Doe P5 AP Biology – Hobbs October 1, 2012 Abstract Diffusion is the movement of molecules from a region of higher concentration to a region of lower concentration. A special kind of diffusion called osmosis only occurs when a selectively permeable membrane separates water with different solute concentrations on both sides of the membrane and the water moves from areas of lower solute concentration to areas of high solute concentration. The solute concentration in osmosis is the water potential. Water potential affects the rate of osmosis. The higher the concentration of solutes, the faster the water will flow through the membrane to equalize the concentration. In the experiment of the osmosis investigation with the dialysis bag, I ascertained that, as the sucrose concentrations in solutions went up, so did the percent change in mass of the bags. In the potato experiment, I noticed that mass of the potato cores increased in mass when I put them in water and decreased in mass when I put them in the various solutions. When submerged in water, the water moved into the potato cores due to the laws of water potential causing the cores to weigh more. When submerged in the solutions, the water from inside the cores moved into the solutions causing a loss of mass in the cores. Introduction The main purpose of the dialysis bag experiment was to compare and contrast the effects of osmosis when different sucrose concentrations determine the movement of water through a selectively permeable membrane. The function of a permeable membrane is to manage what molecules can or cannot come in or out of a cell. The dialysis bags contained many extremely small pores which allowed water to pass in and out of the bags. Water was observed moving from the hypotonic solution to the hypertonic solution. The hypotonic solution was the solution in which the solute concentration outside of the cell was lower than the solute concentration inside the cell. The hypertonic solution was the solution in which the solute concentration outside of the cell was higher than the solute concentration inside the cell. When the water moved from the hypotonic solution to the hypertonic solution, a change of mass occurred. The potato core experiment was similar to the dialysis bag experiment because it applies similar principles. The purpose of the potato core experiment was to observe and analyze how water potential of the potato cores was affected by solutions with different amounts of sucrose concentrations. We recorded the mass and temperature, initial and final, and analyzed the data trends. The increases or decreases in mass showed us which solutions had what effects and whether they were hypotonic or hypertonic. We didn’t have the chance to conduct the plant cell plasmolysis experiment, The purpose of it was to observe and note the characteristics of the plant cell layer under a microscope before and after a few drops of 15% NaCl solution were added. Materials 4 Glucose indicator strips 1 Graduated cylinder 1 Plastic cup, 250 ml dialysis bag tubing, 7 ft. 6 Plastic cups, 250 ml Glucose starch solution, 15 ml IKI (potassium iodide) solution, 1 ml Sucrose solution, 0.2 M, 175 ml Sucrose solution, 0.4 M, 175 ml Sucrose solution, 0.6 M, 175 ml Sucrose solution, 0.8 M, 175 ml Sucrose solution, 1.0 M, 175 ml Distilled water, 175 ml Paper towels Potato Plastic wrap Microscope slide Coverslip Compound microscope Scalpel Forceps Balance Cork borer with plunger NaCl solution, 15% Onion epidermis Procedure I started off the diffusion experiment by pouring 15 ml of the glucose solution into a graduated cylinder. I obtained a piece of water-soaked dialysis tubing and tied a knot in one end. I opened the tubing and poured the 15 ml of glucose solution into the tubing. I noted the color of the solution in the bag and recorded it. To determine if glucose was present in the tubing, I dipped a glucose indicator strip into the solution. I tied a knot in the open end and left enough space in the bag for expansion. I filled a 250 ml beaker two-thirds full with distilled water. I added 1 ml of potassium iodide to the beaker. After a few seconds, I noted the color of the solution. Again, I determined if glucose was present in the solution by dipping a glucose indicator strip in the beaker. I fully immersed the dialysis bag in the solution in the beaker and waited thirty minutes. After a half hour, I removed the dialysis bag from the beaker and recorded the final colors of the solutions. I tested the glucose content in the beaker using a glucose indicator strip. I tested the glucose content in the dialysis bag by cutting a small hole in the bag with scissors and inserting the indicator strip through the hole. Lastly, I recorded the presence or absence of glucose. I began the osmosis experiment by obtaining six plastic cups and I labeled them: water, 0.2 M. 0.4 M, 0.6 M, 0.8 M, and 1.0 M. I obtained six pieces of dialysis tubing from a beaker of water. I tied a knot in each piece of tubing. I opened one piece of tubing and poured 25 ml of distilled water into the tubing and tied a knot at the other end of that tubing. I left enough space in the bag for expansion. I blotted the sealed tubing dry and placed it in the cup labeled “water”. For each of the remaining five pieces of dialysis tubing, I repeated the previous three sentences, adding a different sucrose solution to each bag. I blotted each piece of tubing dry and placed it in the proper cup. After blotting each bag dry, I weighed each one and recorded their initial mass. I filled the plastic cups three-fourths full of distilled water. I immersed each bag in its respective cup. I waited a half hour. I removed the bags from the cups, blotted them dry, and weighed them again. I recorded the final mass. I calculated the percent change in mass for each of the dialysis bags. Lastly, I graphed my results. I started the water potential experiment by obtaining the covered cup with four evenly cut potato cores. I weighed the four cylinders together and recorded the initial mass. I poured 100 ml of my assigned solution into a plastic cup. I recorded the initial temperatures. I let the cup stand overnight. The next day, I recorded the final temperature of the liquid in the cup. I removed the four cylinders from each beaker and blotted them carefully with a paper towel. I weighed them and recorded the final mass. I calculated the percent change in mass for the four potato cylinders. Lastly, I recorded the results from the rest of the groups and graphed my results. For the plant plasmolysis experiment, I observed the plant cell layer under 100x magnification of a microscope in distilled water and drew the appearance of the cells. Then, I observed the plant cell layer in 15% NaCl solution and drew the appearance of the cells. Results Table 1 Diffusion Color Color Glucose Glucose Content Content Time Dialysis Bag Beaker Dialysis Bag Beaker Start Clear Amber Present Absent 30 minutes Purple-black area Amber Present Present Table 2 Osmosis Investigation Solution Dialysis Bag Dialysis Bag Change in Mass % Change in Initial Mass (g) Final Mass (g) (g) Mass Water 25.25 g 24.93 g 0.32 g 1.27% 0.2 M 25.90 g 26.80 g 0.90 g 3.47% 0.4 M 25.98 g 28.61 g 2.63 g 10.12% 0.6 M 27.25 g 29.31 g 2.06 g 7.60% 0.8 M 28.55 g 33.38 g 4.83 g 16.92% 1.0 M 29.30 g 33.40 g 4.10 g 13.99% Table 3 Potato Cell Water Potential Solution Solution Potato Potato Potato Potato Temp. *C Temp. *C Cylinders Cylinders Cylinders Cylinders Initial Final Initial Final Change in % Change Temp Temp Mass (g) Mass (g) Mass (g) in Mass Water 23.5 *C 23*C 5.83 g 6.30 g 0.47 g +8.06% 0.2 M 23.5 *C 23.2*C 4.96 g 4.95 g 0.01 g -0.20% 0.4 M 23*C 23*C 4.84 g 4.10 g 0.74 g -15.29% 0.6 M 26*C 23.3*C 5.15 g 2.00 g 3.15 g -61.17% 0.8 M 23*C 23*C 4.81 g 3.63 g 1.18 g -24.53% 1.0 M 24*C 24*C 4.94 g 3.88 g 1.06 g -21.46% Solution Discussion In the dialysis bags experiment, the results represent that as the concentration of sucrose increased, the final mass and percent change in mass increased as well. The percent increase in the distilled water was 1.27%, but the percent increase in the 1.0 M solution of sucrose was 13.99%. The results show that water diffused through the dialysis bags making them weigh more. The water diffused from the hypotonic solution to the hypertonic solution because water is attracted to the solution with the higher solute concentration. There was a source of error somewhere in the experiment because 0.8 M of sucrose solution had a greater percent change in mass than 1.0 M of sucrose solution. One possibility could be that we didn’t dry the dialysis bag completely before weighing it again and the water on the bag could have added extra weight to the 0.8 M sucrose solution causing it to have a greater percent change in mass. For the potato cell experiment, the results represent the opposite of what the dialysis bag’s results represented. These results proved that as the concentration of sucrose increased, the percent in mass decreased. The potato cores were proven hypertonic to the solution because the water had a positive percent change in mass and water always moves from a region of higher water potential to a region of lower water potential. In the greater concentrations of sucrose solutions, the potato cells were hypotonic to the solution because the water had a negative percent change in mass and they lost mass due to the fact that they had a higher water potential than the outside liquid. I figured there were two sources of error. One source of error was that the percent change in mass of 0.2 M should be positive, but it is slightly negative. The other source of error I noticed was that the percent change in mass of 0.6 M sucrose solution seemed a little outrageous and it is not supposed to have a higher percent change in mass than the 1.0 M sucrose solution. I’m assuming both errors occurred during the process of weighing the potato cells. Perhaps, we were in a hurry to weigh the potato cells and didn’t wait for the number to settle on the scale or maybe they weren’t completely dry. Based my observations of the plant cell plasmolysis, the plant cells were much smaller when exposed to a few drops of %15 NaCl solution. Conclusion I concluded that the hypothesis was correct and proven for the most part. There were a few glitches. From the results, I concluded three things. If the percent difference of a cell is negative, then the cell is hypotonic because water diffuses out of the cell. If the percent difference of a cell is positive, then the cell is hypertonic because the diffused water is coming into the cell. If the percent difference of a cell is zero, then the cell is isotonic because it has the same solute concentration as the solution.
