CZOMetadataWorksheet_GarnerRun_2014Transects
advertisement
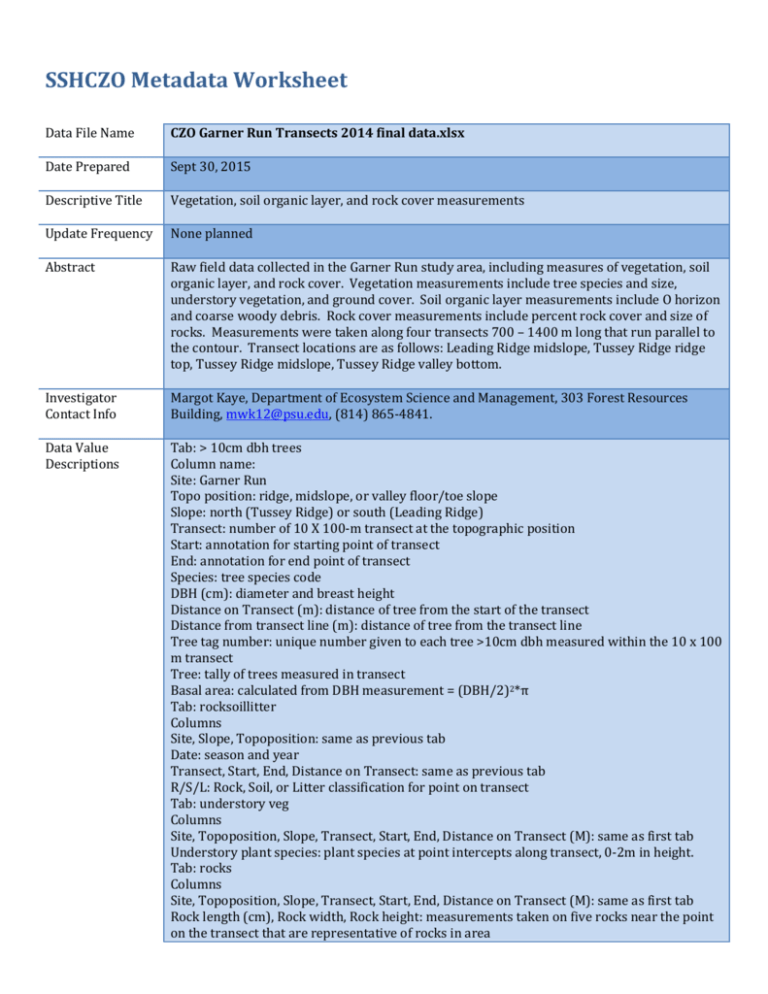
SSHCZO Metadata Worksheet Data File Name CZO Garner Run Transects 2014 final data.xlsx Date Prepared Sept 30, 2015 Descriptive Title Vegetation, soil organic layer, and rock cover measurements Update Frequency None planned Abstract Raw field data collected in the Garner Run study area, including measures of vegetation, soil organic layer, and rock cover. Vegetation measurements include tree species and size, understory vegetation, and ground cover. Soil organic layer measurements include O horizon and coarse woody debris. Rock cover measurements include percent rock cover and size of rocks. Measurements were taken along four transects 700 – 1400 m long that run parallel to the contour. Transect locations are as follows: Leading Ridge midslope, Tussey Ridge ridge top, Tussey Ridge midslope, Tussey Ridge valley bottom. Investigator Contact Info Margot Kaye, Department of Ecosystem Science and Management, 303 Forest Resources Building, mwk12@psu.edu, (814) 865-4841. Data Value Descriptions Tab: > 10cm dbh trees Column name: Site: Garner Run Topo position: ridge, midslope, or valley floor/toe slope Slope: north (Tussey Ridge) or south (Leading Ridge) Transect: number of 10 X 100-m transect at the topographic position Start: annotation for starting point of transect End: annotation for end point of transect Species: tree species code DBH (cm): diameter and breast height Distance on Transect (m): distance of tree from the start of the transect Distance from transect line (m): distance of tree from the transect line Tree tag number: unique number given to each tree >10cm dbh measured within the 10 x 100 m transect Tree: tally of trees measured in transect Basal area: calculated from DBH measurement = (DBH/2)2*π Tab: rocksoillitter Columns Site, Slope, Topoposition: same as previous tab Date: season and year Transect, Start, End, Distance on Transect: same as previous tab R/S/L: Rock, Soil, or Litter classification for point on transect Tab: understory veg Columns Site, Topoposition, Slope, Transect, Start, End, Distance on Transect (M): same as first tab Understory plant species: plant species at point intercepts along transect, 0-2m in height. Tab: rocks Columns Site, Topoposition, Slope, Transect, Start, End, Distance on Transect (M): same as first tab Rock length (cm), Rock width, Rock height: measurements taken on five rocks near the point on the transect that are representative of rocks in area Keywords Tab: woody debris Columns Site, Topo position, Transect, Start, End: same as first tab Aspect: direction slope is facing Segment: segment of transect where measurements were collected 1hr: tally of one-hour fuels intercepting transect, up to 2m height. Blank cells means data were not collected for fuel class in that segment 10hr: tally of 10-hour fuels intercepting transect, up to 2m height. 100hr: tally of 100-hour fuels intercepting transect, up to 2m height. 1000hr: 1000-hour fuel intercepted by transect. Subsequent columns are measurements taken on the 1000-hour fuel. Spp: species, recorded if possible, if not classified as hardwood or softwood Azimuth: direction fuel is lying Distance on line (m): where fuel intercept transect Length (m): length of the fuel Diameter (cm): diameter of fuel where it crosses the transect Decay class: classification from Browns Fuels Trasects Tab: o horizon Columns: Sample collector: initials of person who collected samples. Site, topo position, slope, transect, start, end, distance on transect: same a first tab Bag mass (g): mass of paper bag used to store o horizon sample Wet+bag mass (g): wet mass of o horizon sample with bag Dry+bag mass (g): air dry mass of o horizon sample with bag Tin mass (g): mass of tin for drying Pre 105 + tin mass (g): mass of subsample and tin before drying in oven at 105 deg C Pos 105 + tin mass (g): mass of subsample and tin after drying in oven at 105 deg C Area of ring (m^2): area of o horizon sample taken at each sampling point along transect Vegetation transect, rock cover, rock size, coarse woody debris, organic horizon Methods From Brantley et al. 2015, in review: The objective of our ground-based vegetation sampling in the Garner Run subcatchment was to capture spatial variability in vegetation across the catena (ridge top, midslope, and valley floor positions) and provide the infrastructure for re-measurement of vegetation to capture temporal variability, with the ultimate goal of quantifying the contribution of vegetation to WEGSS fluxes. Vegetation was sampled in four linear transects parallel to the slope contour at the same four topographic positions as soil pits from the catena; Leading Ridge ridge top (LRRT), Leading Ridge midslope (LRMS), Leading Ridge valley floor (LRVF), Tussey Mountain midslope (TMMS) (Figure 5). Each vegetation transect was 10-m wide (i.e. along the direction perpendicular to the valley axis) and 700-1400 m long (i.e. parallel to valley axis). Measurements along transects yielded vegetation and forest floor cover data for 4.1 ha in the subcatchment. In that area 2241 trees > 10 cm diameter at breast height were measured, mapped, and permanently tagged. Understory vegetation composition was measured at 5-m point intervals along transects and course woody debris measured in 25-m planar transects parallel to the main transect, spaced every 100-m. Based on our interest in relating geomorphology and vegetation dynamics, the size of the five largest exposed rocks was recorded very 25-m by measuring their 1st, 2nd and 3rd axes. Forest floor cover was classified as rock, bare soil, or leaf litter at point intercepts every 1 m along the transect. Forest floor biomass was measured every 25-m along transects by removing the organic horizon from a 0.03 m2 area, drying and massing samples in the lab, and measuring carbon loss on ignition. Sites Garner Run Publications Discussion paper under review at Earth Surface Dynamics: Brantley, S. L., DiBiase, R., Russo, T., Shi, Y., Lin, H., Davis, K. J., Kaye, M., Hill, L., Kaye, J., Neal, A. L., Eissenstat, D., Hoagland, B., and Dere, A. L.: Designing a suite of measurements to understand the critical zone, Earth Surf. Dynam. Discuss., 3, 1005-1059, doi:10.5194/esurfd-3-1005-2015, 2015. Citation Data Use Notes The following acknowledgment should accompany any publication or citation of these data: Logistical support and/or data were provided by the NSF-supported Shale Hills Susquehanna Critical Zone Observatory. The user of Shale Hills Susquehanna CZO data agrees to provide proper acknowledgment with each usage of the data. Citation of the name(s) of the investigator(s) responsible for the data set, in addition to the generic statement above, constitutes proper acknowledgment. Author(s) (including Shale Hills Susquehanna CZO investigators) of published material that makes use of previously unpublished Shale Hills Susquehanna CZO data agree to provide the Shale Hills Susquehanna CZO data manager with four (4) copies (preferably reprints) of that material for binding as soon as it becomes available. The user of Shale Hills Susquehanna CZO data agrees not to resell or redistribute shared data. The user of these data should be aware that, while efforts have been taken to ensure that these data are of the highest quality, there is no guarantee of perfection for the data contained herein and the possibility of errors exists. These data are defined as either public or private, such that a password may be required for access.
