README.
advertisement
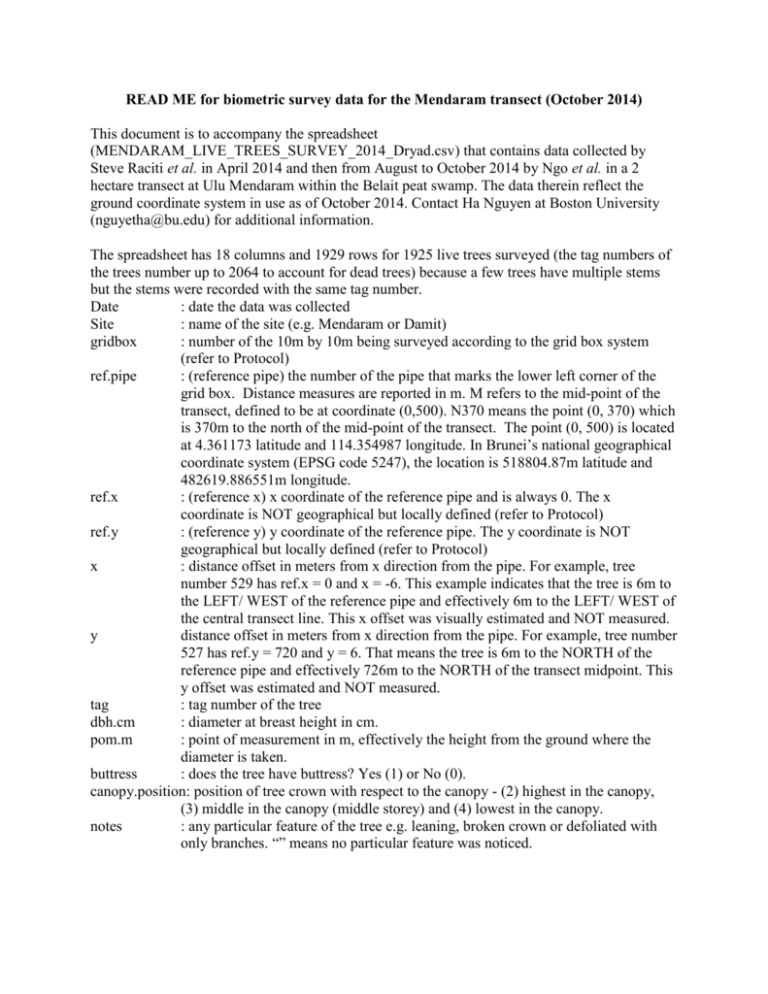
READ ME for biometric survey data for the Mendaram transect (October 2014) This document is to accompany the spreadsheet (MENDARAM_LIVE_TREES_SURVEY_2014_Dryad.csv) that contains data collected by Steve Raciti et al. in April 2014 and then from August to October 2014 by Ngo et al. in a 2 hectare transect at Ulu Mendaram within the Belait peat swamp. The data therein reflect the ground coordinate system in use as of October 2014. Contact Ha Nguyen at Boston University (nguyetha@bu.edu) for additional information. The spreadsheet has 18 columns and 1929 rows for 1925 live trees surveyed (the tag numbers of the trees number up to 2064 to account for dead trees) because a few trees have multiple stems but the stems were recorded with the same tag number. Date : date the data was collected Site : name of the site (e.g. Mendaram or Damit) gridbox : number of the 10m by 10m being surveyed according to the grid box system (refer to Protocol) ref.pipe : (reference pipe) the number of the pipe that marks the lower left corner of the grid box. Distance measures are reported in m. M refers to the mid-point of the transect, defined to be at coordinate (0,500). N370 means the point (0, 370) which is 370m to the north of the mid-point of the transect. The point (0, 500) is located at 4.361173 latitude and 114.354987 longitude. In Brunei’s national geographical coordinate system (EPSG code 5247), the location is 518804.87m latitude and 482619.886551m longitude. ref.x : (reference x) x coordinate of the reference pipe and is always 0. The x coordinate is NOT geographical but locally defined (refer to Protocol) ref.y : (reference y) y coordinate of the reference pipe. The y coordinate is NOT geographical but locally defined (refer to Protocol) x : distance offset in meters from x direction from the pipe. For example, tree number 529 has ref.x = 0 and x = -6. This example indicates that the tree is 6m to the LEFT/ WEST of the reference pipe and effectively 6m to the LEFT/ WEST of the central transect line. This x offset was visually estimated and NOT measured. y distance offset in meters from x direction from the pipe. For example, tree number 527 has ref.y = 720 and y = 6. That means the tree is 6m to the NORTH of the reference pipe and effectively 726m to the NORTH of the transect midpoint. This y offset was estimated and NOT measured. tag : tag number of the tree dbh.cm : diameter at breast height in cm. pom.m : point of measurement in m, effectively the height from the ground where the diameter is taken. buttress : does the tree have buttress? Yes (1) or No (0). canopy.position: position of tree crown with respect to the canopy - (2) highest in the canopy, (3) middle in the canopy (middle storey) and (4) lowest in the canopy. notes : any particular feature of the tree e.g. leaning, broken crown or defoliated with only branches. “” means no particular feature was noticed. biomass : biomass in kg estimated using the Chave et al. (2005) DBH-only model for moist tropical forest. For Shorea albida, the biomass was further adjusted to account for hollow stems. Biometric study design Mendaram site, Brunei 2014 A transect for biometric survey was laid out at the Mendaram field site in a north-south orientation, approximately 100m to the east of the flux tower. The transect covered an area of 20 m x 1000 m (2 ha) (Figure 1). A PVC grid was laid out across the full transect every 10m. PVC stakes were inserted along the edges (+ and – 90o from the central bearing line) of the transect and along the central transect axis at 10m intervals. Figure 1: Grid layout Aboveground biomass was estimated across the 2 ha sample area. All trees stems with a minimum diameter at breast height (DBH, measured at a height of 1.37m, or above the buttress) ≥ 5cm were tagged, measured, mapped (with ~1m), and identified to species (if possible). Datasheets X and Y coordinates to within ~1m for each tree. Each tree meeting the minimum size requirements had a tag mounted to the tree using galvanized steel nail. All tags were oriented towards the central transect line. Nails were nailed into the tree at a height of 1.17m above the ground surface (20 cm below the height of the DBH measurement point) to mark the level for future DBH measurement. Given the variability in the peat surface characteristics, a clear reference point for future DBH measurements would improve the accuracy of future resurveys. For buttressed trees, the diameter was measured 30 cm above the top of the buttress. Two nails were inserted into buttressed trees: the first nail (with tag) was inserted at 1.6m (eyelevel) for rapid identification; a second nail was inserted 20cm below the measurement point (above the buttress). A reference stick was used by each team with the heights of 1.37 and 1.17m delineated for precise and rapid measurement. The diameter of each tree was measured using DBH tapes to a precision of 0.1cm. Where possible, genus and species was be identified in the field. Within the notes column of the data information such as the following were noted as appropriate: Broken crown Crown encased in lianas For snags, record base and top diameter Adjacent to large clearing/gaps Etc… The Chave et al. (2005) allometric relationship for moist tropical forests was applied to estimate AGB from the field biometric survey. Other allometries could have been used, but the Chave et al. (2005) equation was developed from an extensive database containing several sites in Southeast Asian Dipterocarp forests and has been widely applied in pan-tropical studies, including several that we compared with. AGB (kg) was estimated using DBH (cm) and wood density (ρ; in g cm-3) such that AGB = S ∗ e−1.499+2.148 ∗ln(DBH)+ 0.207 ∗ (ln(DBH)) 2 − 0.0281∗(ln(DBH))3 Wood density of 0.619 g cm-3 was used for S. albida (Monda et al. 2015) and 0.6 g cm-3 was applied for all other species (Osunkoya et al. 2007). To account for the very strong tendency of large S. albida individuals to be hollow, we multiplied their estimated dry mass from (2) by 0.577, using the average fraction of dense wood volume for S. albida in Sarawak, Malaysia observed in Monda et al. (2015). References Chave, J., Andalo, C., Brown, S., Cairns, M.A., Chambers, J.Q., Eamus, D., Fo¨lster, F.H., Fromard F., Higuchi, N., Lescure, J.P., Nelson, B.W., Ogawa, H., Puig, H., Riera, B., Yamakura, T. 2005. Tree allometry and improved estimation of carbon stocks and balance in tropical forests. Oecologia, 145, 87–99. Monda, Y., Kiyono, Y., Melling, L., Damian, C., & Chaddy, A. (2015). Allometric equation considering the influence of hollow trees: A case study for tropical peat swamp forest in Sarawak. Tropics, 24(1), in press. Osunkoya, O. O., Sheng, T. K., Mahund, N. A., & Damit, N. (2007). Variation in wood density, wood water content, stem growth and mortality among twenty‐seven tree species in a tropical rainforest on Borneo Island. Austral Ecology, 32(2), 191-201.
