README.
advertisement
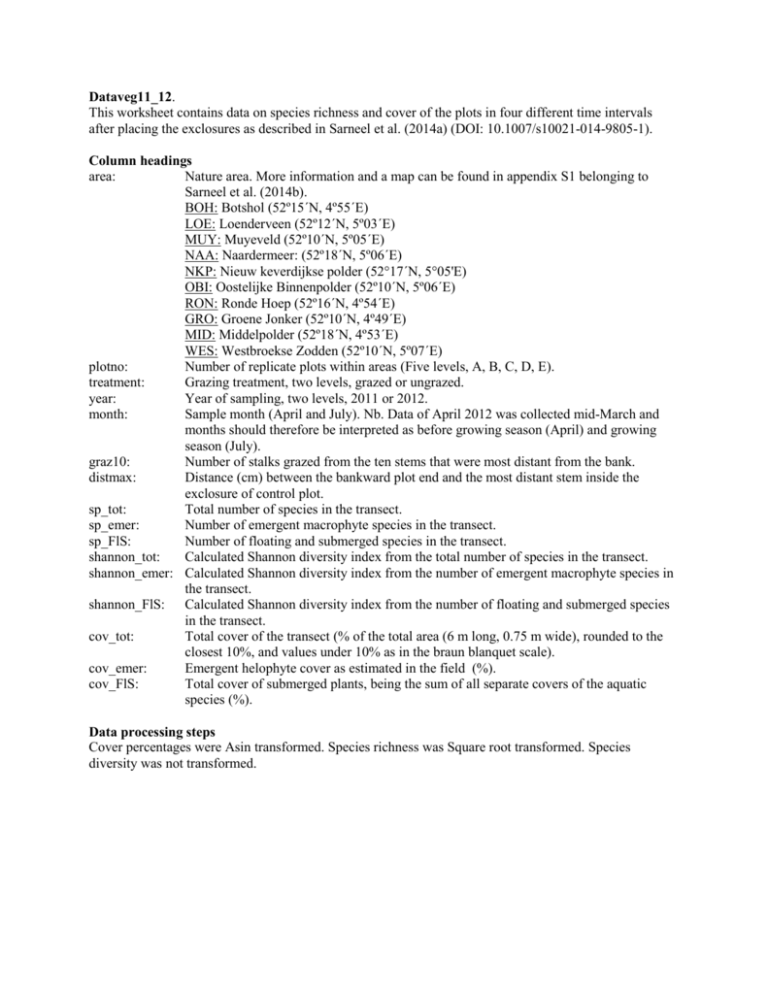
Dataveg11_12. This worksheet contains data on species richness and cover of the plots in four different time intervals after placing the exclosures as described in Sarneel et al. (2014a) (DOI: 10.1007/s10021-014-9805-1). Column headings area: Nature area. More information and a map can be found in appendix S1 belonging to Sarneel et al. (2014b). BOH: Botshol (52º15´N, 4º55´E) LOE: Loenderveen (52º12´N, 5º03´E) MUY: Muyeveld (52º10´N, 5º05´E) NAA: Naardermeer: (52º18´N, 5º06´E) NKP: Nieuw keverdijkse polder (52°17´N, 5°05'E) OBI: Oostelijke Binnenpolder (52º10´N, 5º06´E) RON: Ronde Hoep (52º16´N, 4º54´E) GRO: Groene Jonker (52º10´N, 4º49´E) MID: Middelpolder (52º18´N, 4º53´E) WES: Westbroekse Zodden (52º10´N, 5º07´E) plotno: Number of replicate plots within areas (Five levels, A, B, C, D, E). treatment: Grazing treatment, two levels, grazed or ungrazed. year: Year of sampling, two levels, 2011 or 2012. month: Sample month (April and July). Nb. Data of April 2012 was collected mid-March and months should therefore be interpreted as before growing season (April) and growing season (July). graz10: Number of stalks grazed from the ten stems that were most distant from the bank. distmax: Distance (cm) between the bankward plot end and the most distant stem inside the exclosure of control plot. sp_tot: Total number of species in the transect. sp_emer: Number of emergent macrophyte species in the transect. sp_FlS: Number of floating and submerged species in the transect. shannon_tot: Calculated Shannon diversity index from the total number of species in the transect. shannon_emer: Calculated Shannon diversity index from the number of emergent macrophyte species in the transect. shannon_FlS: Calculated Shannon diversity index from the number of floating and submerged species in the transect. cov_tot: Total cover of the transect (% of the total area (6 m long, 0.75 m wide), rounded to the closest 10%, and values under 10% as in the braun blanquet scale). cov_emer: Emergent helophyte cover as estimated in the field (%). cov_FlS: Total cover of submerged plants, being the sum of all separate covers of the aquatic species (%). Data processing steps Cover percentages were Asin transformed. Species richness was Square root transformed. Species diversity was not transformed. Gradient data. This worksheet contains data on environmental characteristics and vegetation per plot at the end of the two growing seasons that the experiment lasted. Also the change in vegetation cover and species richness is given per plot. Column headings area: Nature area. As in the worksheet ‘Dataveg11_12’. plotno: replicate plots within areas (five levels, A to E). treatment: Grazing treatment, two levels, grazed or ungrazed. spec_transect_J11: Number of species found per transect in July 2011. cov_11: Total cover of the emergent vegetation in July 2011 (%). N_11: Total N concentration (% of the collected dry weight) in the plant tissue of the samples taken in the marginal wetland phase in 2011. C_11 Total C concentration (% of the collected dry weight) in the plant tissue of the samples taken in the marginal wetland phase in 2011. P_11 Total P concentration (% of the collected dry weight) in the plant tissue of the samples taken in the marginal wetland phase in 2011. NP_11 N:P ration in the plant tissue of the samples taken in the marginal wetland phase in 2011. spec_transect_J12: Number of species found per transect in July 2012. cov_12: Total cover of the emergent vegetation in July 2012 (%). N_12: Total N concentration (% of the collected dry weight) in the plant tissue of the samples taken in the marginal wetland phase in 2012. C_12 Total C concentration (% of the collected dry weight) in the plant tissue of the samples taken in the marginal wetland phase in 2012. P_12 Total P concentration (% of the collected dry weight) in the plant tissue of the samples taken in the marginal wetland phase in 2012. NP_12 N:P ration in the plant tissue of the samples taken in the marginal wetland phase in 2012. water_depth: Averaged water depth of the transect (m). fowl: Waterfowl present in the area as an average of the animals counted during the separate visits (kg bodymass ha-1). livestock: Livestock present in the area as an average of the animals counted during the separate visits (kg bodymass ha-1). rats_11: Muskrats present in the area in 2011 (kg bodymass ha-1) as obtained from muskrat catchers. rats_12: Muskrat presence in the area in 2012 (kg bodymass ha-1) as obtained from muskrat catchers. cov_incr: Increase in cover (%) of the emergent vegetation from 2011 to 2012. spec_col: Absolute number of species that was not found in 2011 but was found in 2012 in the transect and thus must have colonized the transect. spec_ex: Absolute number of species that was found in 2011 but was not found in 2012 in the transect and thus have gone extinct the transect. prop_col: Proportion of species that colonized the transect in 2012 relative to the number of species in 2011. prop_ex: Proportion of species disappeared from the transect in 2012 relative to the number of species in 2011. Biomass. This worksheet contains data on the biomass samples taken from three different locations in the transect (see Figure 1 of the article for the location of the samples). Column headings area: Nature area. As in the worksheet ‘Dataveg11_12’ plotno: replicate plots within areas (five levels, A to E). treatment: Grazing treatment, two levels, grazed or ungrazed. transect: Location in the transect where the sample is taken. Three levels, A = Marginal wetland, B = Emergent vegetation fringe, C = Open water. biomass: Dry weight (g) of all the living above ground vegetation in the 0.2m2 plot species: Number of species in the harvested biomass sample. References used Sarneel, J. M., N. Huig, G. F. Veen, W. Rip, and E. S. Bakker. 2014a. Herbivores enforce sharp boundaries between terrestrial and aquatic ecosystems. Ecosystems, Doi: 10.1007/s10021-014-9805-1. Sarneel, J. M., R. H. Janssen, W. Rip, I. M. A. Bender, and E. S. Bakker. 2014b. Windows of opportunity for germination of riparian species after restoring water level fluctuations: a field experiment with controlled seed banks. Journal of Applied Ecology 51:1006–1014, Doi: 10.1111/13652664.12288.
