README.
advertisement
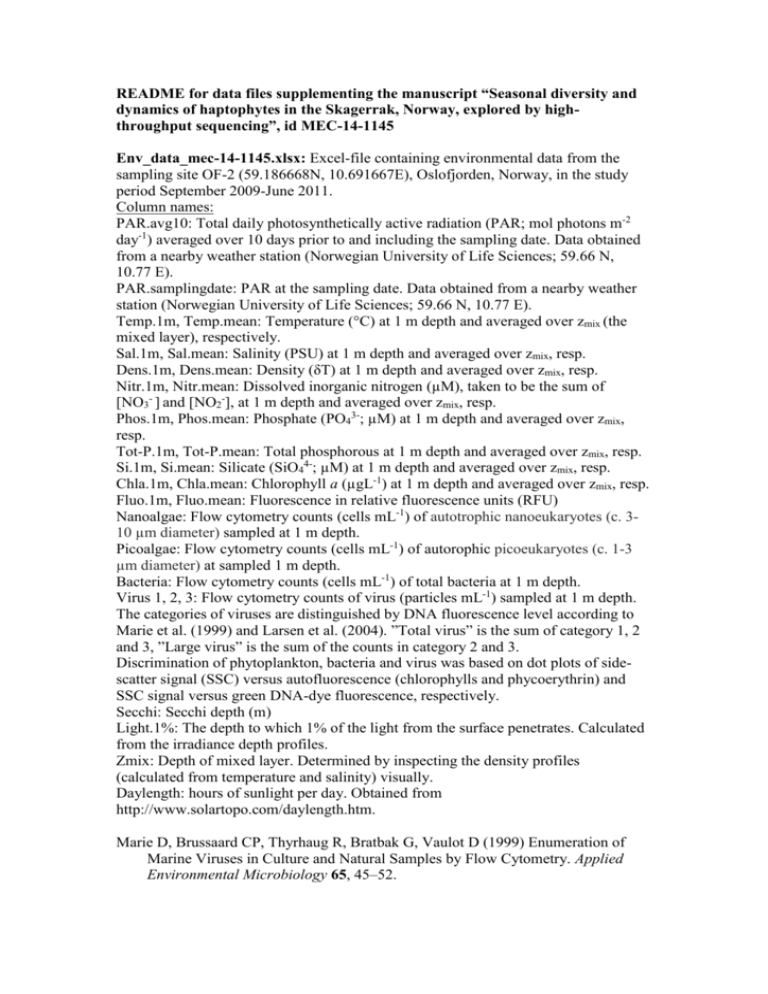
README for data files supplementing the manuscript “Seasonal diversity and dynamics of haptophytes in the Skagerrak, Norway, explored by highthroughput sequencing”, id MEC-14-1145 Env_data_mec-14-1145.xlsx: Excel-file containing environmental data from the sampling site OF-2 (59.186668N, 10.691667E), Oslofjorden, Norway, in the study period September 2009-June 2011. Column names: PAR.avg10: Total daily photosynthetically active radiation (PAR; mol photons m-2 day-1) averaged over 10 days prior to and including the sampling date. Data obtained from a nearby weather station (Norwegian University of Life Sciences; 59.66 N, 10.77 E). PAR.samplingdate: PAR at the sampling date. Data obtained from a nearby weather station (Norwegian University of Life Sciences; 59.66 N, 10.77 E). Temp.1m, Temp.mean: Temperature (°C) at 1 m depth and averaged over zmix (the mixed layer), respectively. Sal.1m, Sal.mean: Salinity (PSU) at 1 m depth and averaged over zmix, resp. Dens.1m, Dens.mean: Density (δT) at 1 m depth and averaged over zmix, resp. Nitr.1m, Nitr.mean: Dissolved inorganic nitrogen (µM), taken to be the sum of [NO3- ] and [NO2-], at 1 m depth and averaged over zmix, resp. Phos.1m, Phos.mean: Phosphate (PO43-; µM) at 1 m depth and averaged over zmix, resp. Tot-P.1m, Tot-P.mean: Total phosphorous at 1 m depth and averaged over zmix, resp. Si.1m, Si.mean: Silicate (SiO44-; µM) at 1 m depth and averaged over zmix, resp. Chla.1m, Chla.mean: Chlorophyll a (µgL-1) at 1 m depth and averaged over zmix, resp. Fluo.1m, Fluo.mean: Fluorescence in relative fluorescence units (RFU) Nanoalgae: Flow cytometry counts (cells mL-1) of autotrophic nanoeukaryotes (c. 310 µm diameter) sampled at 1 m depth. Picoalgae: Flow cytometry counts (cells mL-1) of autorophic picoeukaryotes (c. 1-3 µm diameter) at sampled 1 m depth. Bacteria: Flow cytometry counts (cells mL-1) of total bacteria at 1 m depth. Virus 1, 2, 3: Flow cytometry counts of virus (particles mL-1) sampled at 1 m depth. The categories of viruses are distinguished by DNA fluorescence level according to Marie et al. (1999) and Larsen et al. (2004). ”Total virus” is the sum of category 1, 2 and 3, ”Large virus” is the sum of the counts in category 2 and 3. Discrimination of phytoplankton, bacteria and virus was based on dot plots of sidescatter signal (SSC) versus autofluorescence (chlorophylls and phycoerythrin) and SSC signal versus green DNA-dye fluorescence, respectively. Secchi: Secchi depth (m) Light.1%: The depth to which 1% of the light from the surface penetrates. Calculated from the irradiance depth profiles. Zmix: Depth of mixed layer. Determined by inspecting the density profiles (calculated from temperature and salinity) visually. Daylength: hours of sunlight per day. Obtained from http://www.solartopo.com/daylength.htm. Marie D, Brussaard CP, Thyrhaug R, Bratbak G, Vaulot D (1999) Enumeration of Marine Viruses in Culture and Natural Samples by Flow Cytometry. Applied Environmental Microbiology 65, 45–52. Larsen A, Flaten GAF, Sandaa R-A, Castberg T, Thyrhaug R, Erga SR, Jacquet S, Bratbak G (2004) Spring phytoplankton bloom dynamics in Norwegian coastal waters: Microbial community succession and diversity. Limnology and Oceanography, 49, 180–190. Table_S2_Egge_et_al_2015_jeukmic.docx: Table containing information about the haptophyte V4 SSU rRNA OTUs recorded in Skagerrak in the period September 2009 – June 2011. First published in Egge ES, Eikrem W, Edvardsen B (2015) “Deepbranching Novel Lineages and High Diversity of Haptophytes in the Skagerrak (Norway) Uncovered by 454 Pyrosequencing”, Journal of Eukaryotic Microbiology 62, 121-140. DOI: 10.1111/jeu.12157 Haptophyte_ref_alignment_284tax.fas: Reference alignment comprising 281 haptophyte 18S rDNA sequences representing all cultured haptophyte species, environmental sequences forming novel clades, and the best BLAST hits in NCBI-nr to the Oslofjorden OTUs. Three outgroup sequences are included (AJ564771 Telonema subtilis, AY919672 Kathablepharis remigera, L28811 Chilomonas paramecium). The sequences from cultured species and environmental sequences that formed novel clades were aligned in MAFFT v.6 with the Q-INS-i strategy (Katoh and Toh 2008). BLAST hits in NCBI-nr that were not already present in the alignment were inserted into the existing alignment using the add-in function in MAFFT for full-length sequences, with method L-INS-1 (Katoh and Frith 2012). Katoh K, Toh H 2008. Improved accuracy of multiple ncRNA alignment by incorporating structural information into a MAFFT-based framework. BMC Bioinformatics, 9, 212. doi:10.1186/1471-2105-9-212 Katoh K, Frith MC 2012. Adding unaligned sequences into an existing alignment using MAFFT and LAST. Bioinformatics, 28, 3144-3146. doi:10.1093/bioinformatics/bts578.
