Freshwater Quality Lab
advertisement
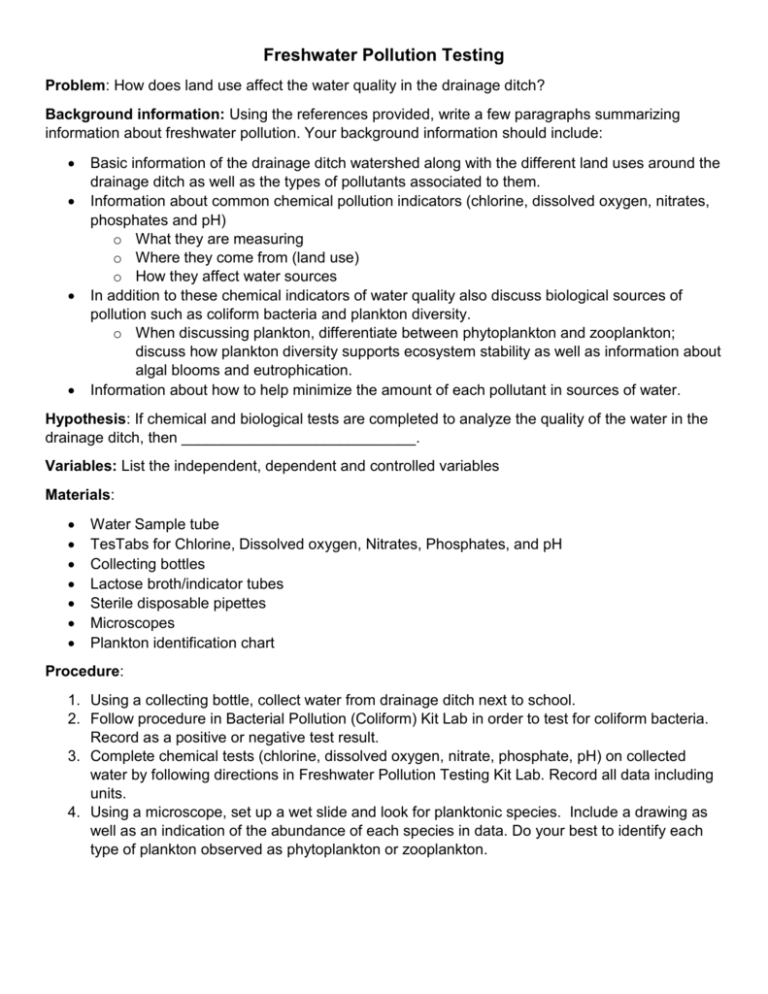
Freshwater Pollution Testing Problem: How does land use affect the water quality in the drainage ditch? Background information: Using the references provided, write a few paragraphs summarizing information about freshwater pollution. Your background information should include: Basic information of the drainage ditch watershed along with the different land uses around the drainage ditch as well as the types of pollutants associated to them. Information about common chemical pollution indicators (chlorine, dissolved oxygen, nitrates, phosphates and pH) o What they are measuring o Where they come from (land use) o How they affect water sources In addition to these chemical indicators of water quality also discuss biological sources of pollution such as coliform bacteria and plankton diversity. o When discussing plankton, differentiate between phytoplankton and zooplankton; discuss how plankton diversity supports ecosystem stability as well as information about algal blooms and eutrophication. Information about how to help minimize the amount of each pollutant in sources of water. Hypothesis: If chemical and biological tests are completed to analyze the quality of the water in the drainage ditch, then ____________________________. Variables: List the independent, dependent and controlled variables Materials: Water Sample tube TesTabs for Chlorine, Dissolved oxygen, Nitrates, Phosphates, and pH Collecting bottles Lactose broth/indicator tubes Sterile disposable pipettes Microscopes Plankton identification chart Procedure: 1. Using a collecting bottle, collect water from drainage ditch next to school. 2. Follow procedure in Bacterial Pollution (Coliform) Kit Lab in order to test for coliform bacteria. Record as a positive or negative test result. 3. Complete chemical tests (chlorine, dissolved oxygen, nitrate, phosphate, pH) on collected water by following directions in Freshwater Pollution Testing Kit Lab. Record all data including units. 4. Using a microscope, set up a wet slide and look for planktonic species. Include a drawing as well as an indication of the abundance of each species in data. Do your best to identify each type of plankton observed as phytoplankton or zooplankton. Data: Cut and paste the data table below into your lab write-up. Factor Test Results Chlorine Dissolved oxygen Nitrate Phosphate pH Bacterial Presence Type of Plankton Species #1 Species #2 Species #3 Phytoplankton Zooplankton Observation of abundance of plankton in sample: ________________________________________________________________________________ ________________________________________________________________________________ ________________________________________________________________________________ ________________________________________________________________________________ Conclusion: Be sure to…. 1. Restate hypothesis and Accept/Reject using data. 2. Discuss why your results turned out this way. Use information about land use, the questions at the end of the Freshwater Pollution Testing Kit lab and the information you were asked to include in your background information. 3. State errors and ways to improve the lab if you were to complete it again.
