file - BioMed Central
advertisement
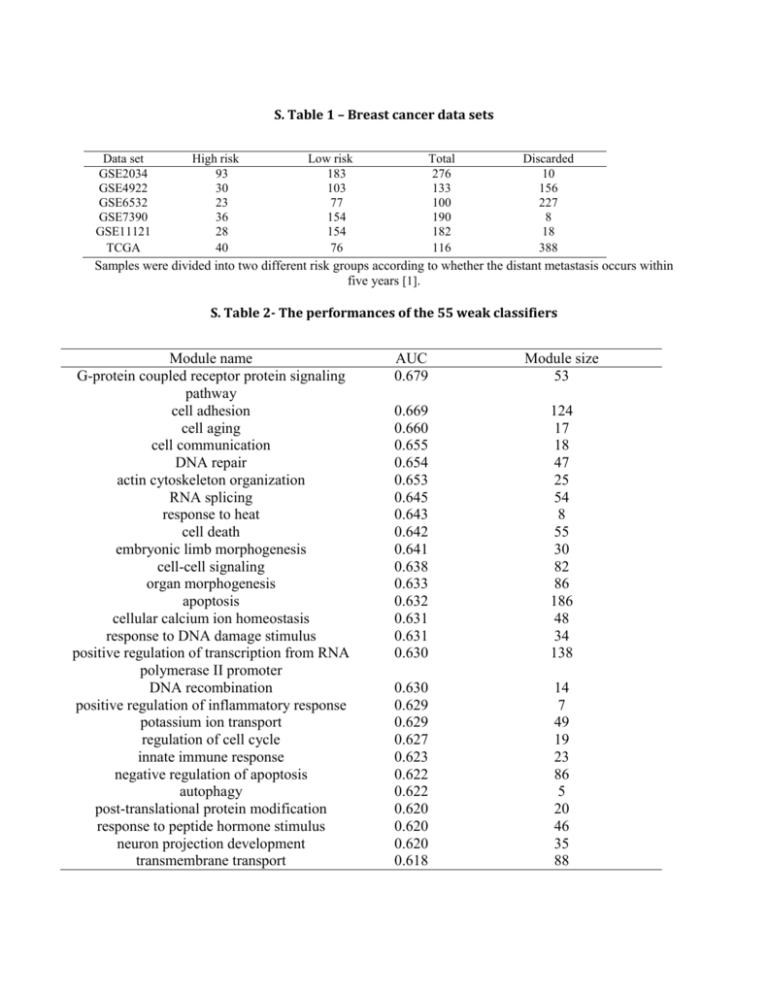
S. Table 1 – Breast cancer data sets Data set GSE2034 GSE4922 GSE6532 GSE7390 GSE11121 TCGA High risk 93 30 23 36 28 40 Low risk 183 103 77 154 154 76 Total 276 133 100 190 182 116 Discarded 10 156 227 8 18 388 Samples were divided into two different risk groups according to whether the distant metastasis occurs within five years [1]. S. Table 2- The performances of the 55 weak classifiers Module name G-protein coupled receptor protein signaling pathway cell adhesion cell aging cell communication DNA repair actin cytoskeleton organization RNA splicing response to heat cell death embryonic limb morphogenesis cell-cell signaling organ morphogenesis apoptosis cellular calcium ion homeostasis response to DNA damage stimulus positive regulation of transcription from RNA polymerase II promoter DNA recombination positive regulation of inflammatory response potassium ion transport regulation of cell cycle innate immune response negative regulation of apoptosis autophagy post-translational protein modification response to peptide hormone stimulus neuron projection development transmembrane transport AUC 0.679 Module size 53 0.669 0.660 0.655 0.654 0.653 0.645 0.643 0.642 0.641 0.638 0.633 0.632 0.631 0.631 0.630 124 17 18 47 25 54 8 55 30 82 86 186 48 34 138 0.630 0.629 0.629 0.627 0.623 0.622 0.622 0.620 0.620 0.620 0.618 14 7 49 19 23 86 5 20 46 35 88 negative regulation of signal transduction cell migration response to stress regulation of cell proliferation inflammatory response skeletal system development cell division cytokinesis transport interspecies interaction between organisms response to vitamin A meiosis response to ethanol anti-apoptosis positive regulation of peptidyl-serine phosphorylation ion transport positive regulation of NF-kappaB transcription factor activit microtubule cytoskeleton organization protein homooligomerization cytokine-mediated signaling pathway response to mechanical stimulus cell-cell adhesion axon guidance chemotaxis protein ubiquitination cholesterol metabolic process anaphase-promoting complex-dependent proteasomal ubiquitin-dependent protein catabolic process response to insulin stimulus 0.617 0.617 0.617 0.614 0.614 0.614 0.613 0.612 0.612 0.612 0.611 0.610 0.609 0.609 0.609 8 56 53 46 67 51 44 12 230 112 7 5 35 83 9 0.609 0.608 95 24 0.607 0.605 0.605 0.605 0.603 0.603 0.603 0.602 0.602 0.601 18 28 22 26 47 42 85 48 10 5 0.601 22 Module name is assigned by the Go Term name, AUC is the performance of the module classifier on Wang dataset (GSE2034), while the module size is the number of miRNA that regulate the Go Term. S. Table 3- The Classification performance of ensemble classifier GSE2034 GSE7390 GSE11121 GSE4922 GSE6532 ACC 0.66 0.64 0.78 0.76 0.73 SN 0.70 0.62 0.83 0.69 0.80 SP 0.65 0.74 0.50 0.88 0.52 AUC 0.73 0.74 0.71 0.69 0.75 MCC 0.29 0.29 0.29 0.24 0.30 The predictive power of the ensemble classifier on the five data sets [1]. S. Table 4 - The classification performance of the Set_median classifier GSE2034 GSE7390 GSE11121 GSE4922 GSE6532 ACC 0.63 0.65 0.62 0.37 0.65 SN 0.64 0.65 0.60 0.23 0.66 SP 0.61 0.67 0.77 0.87 0.60 AUC 0.68 0.71 0.75 0.63 0.72 MCC 0.25 0.25 0.27 0.07 0.24 The number of the feature at best performance is 196. S. Table 5 - The classification performance of the Set_centroid classifier GSE2034 GSE7390 GSE11121 GSE4922 GSE6532 ACC 0.63 0.64 0.61 0.39 0.67 SN 0.64 0.71 0.57 0.27 0.70 SP 0.62 0.62 0.80 0.80 0.58 AUC 0.67 0.71 0.75 0.65 0.71 MCC 0.25 0.26 0.28 0.08 0.25 The number of the feature at best performance is 173. S. Table 6 - The classification performance of the 70 gene signature classifier GSE2034 GSE7390 GSE11121 GSE4922 GSE6532 ACC 0.60 0.67 0.77 0.73 0.66 SN 0.64 0.69 0.83 0.85 0.83 SP 0.53 0.57 0.44 0.28 0.09 AUC 0.59 0.64 0.66 0.57 0.47 MCC 0.17 0.21 0.24 0.15 -0.09 The detailed result of the 70 gene classifier on the five NCBI data sets S. Table 7 - The classification performance of the 76 gene signature classifier GSE2034 GSE7390 GSE11121 GSE4922 GSE6532 ACC 0.63 0.67 0.44 0.23 0.23 SN 0.76 0.69 0.39 0 0 SP 0.38 0.57 0.71 1 1 AUC 0.57 0.63 0.55 0.5 0.5 MCC 0.14 0.21 0.08 0 0 The detailed result of the 76 gene classifier on the five NCBI data sets Reference 1. Zhou X, Liu J, Xiong J: Predicting distant metastasis in breast cancer using ensemble classifier based on context specific miRNA regulation modules. In: IEEE International Conference on Bioinformatics and Biomedicine: 2012; Philadelphia. 23-28.


