A-look-at-early-speed
advertisement
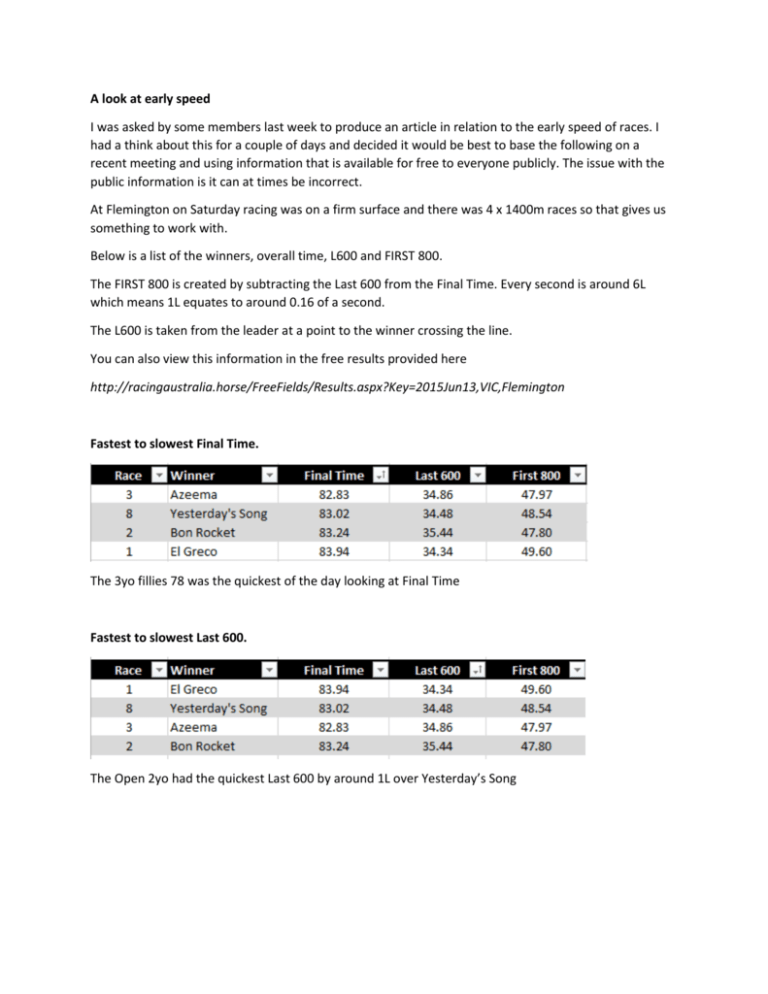
A look at early speed I was asked by some members last week to produce an article in relation to the early speed of races. I had a think about this for a couple of days and decided it would be best to base the following on a recent meeting and using information that is available for free to everyone publicly. The issue with the public information is it can at times be incorrect. At Flemington on Saturday racing was on a firm surface and there was 4 x 1400m races so that gives us something to work with. Below is a list of the winners, overall time, L600 and FIRST 800. The FIRST 800 is created by subtracting the Last 600 from the Final Time. Every second is around 6L which means 1L equates to around 0.16 of a second. The L600 is taken from the leader at a point to the winner crossing the line. You can also view this information in the free results provided here http://racingaustralia.horse/FreeFields/Results.aspx?Key=2015Jun13,VIC,Flemington Fastest to slowest Final Time. The 3yo fillies 78 was the quickest of the day looking at Final Time Fastest to slowest Last 600. The Open 2yo had the quickest Last 600 by around 1L over Yesterday’s Song Fastest to slowest First 800. BM70 winner Bon Rocket went out the quickest of the 1400m winners on the day over the first 800m. Now that we have a basic understanding of how the races were shaped up lets take a look at the horses that were able to lead in each of those races and match them up with each other on the day and see what margin they would have had on each other in a ‘virtual race’ So in our virtual race we have Bon Rocket about 1L ahead of Fast Approaching, then it is 3.5L back to Free Of Doubt and a further 6.5L back to Alamonteel. Let’s make a grid and get a better visual of this example. As you can clearly see the variance in the lead speed on the same day over four races can be significant. If these four horses were to race each other next week your form guide would have them all marked down as leaders. It also then drags through all of the races. If we look at the Bon Rocket race and a horse like So Does He who was always out the back his form will have him 14 of 14 or similar. For the purpose of this exercise if we say he was 11L from the leader Bon Rocket and we slot him onto our grid above he actually would have been right up on the speed with Alamonteel the leader of the 2yo race. Using this type of analysis can be tricky and difficult off of one days racing but as you build a database of horses runs you can quickly start to learn where, when and how they get their wins and losses. You can also understand how connections and trainers get it very wrong quite often when they decide to change tactics based on where a horse generally maps as opposed to how fast it is comfortable running early. Could you imagine So Does He’s rider being told to ride quiet and settle back in the field when Alamonteel is the leader? Or the rider of Alamonteel being told to lead at all costs against Bon Rocket? These two scenarios have both horses out of there comfort zone instantly and it’s a case of tearing up your tickets. Hope this helps with a but more understanding of speed and mapping.
