Introductory Statistics - University of Wisconsin
advertisement
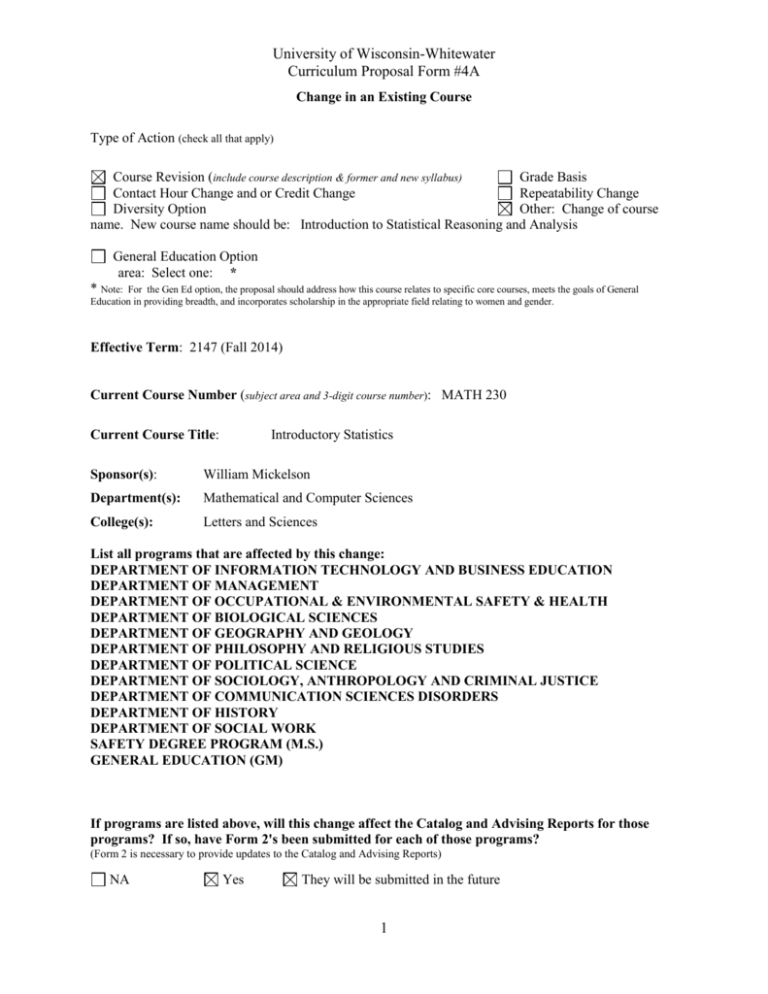
University of Wisconsin-Whitewater Curriculum Proposal Form #4A Change in an Existing Course Type of Action (check all that apply) Course Revision (include course description & former and new syllabus) Grade Basis Contact Hour Change and or Credit Change Repeatability Change Diversity Option Other: Change of course name. New course name should be: Introduction to Statistical Reasoning and Analysis General Education Option area: Select one: * * Note: For the Gen Ed option, the proposal should address how this course relates to specific core courses, meets the goals of General Education in providing breadth, and incorporates scholarship in the appropriate field relating to women and gender. Effective Term: 2147 (Fall 2014) Current Course Number (subject area and 3-digit course number): MATH 230 Current Course Title: Introductory Statistics Sponsor(s): William Mickelson Department(s): Mathematical and Computer Sciences College(s): Letters and Sciences List all programs that are affected by this change: DEPARTMENT OF INFORMATION TECHNOLOGY AND BUSINESS EDUCATION DEPARTMENT OF MANAGEMENT DEPARTMENT OF OCCUPATIONAL & ENVIRONMENTAL SAFETY & HEALTH DEPARTMENT OF BIOLOGICAL SCIENCES DEPARTMENT OF GEOGRAPHY AND GEOLOGY DEPARTMENT OF PHILOSOPHY AND RELIGIOUS STUDIES DEPARTMENT OF POLITICAL SCIENCE DEPARTMENT OF SOCIOLOGY, ANTHROPOLOGY AND CRIMINAL JUSTICE DEPARTMENT OF COMMUNICATION SCIENCES DISORDERS DEPARTMENT OF HISTORY DEPARTMENT OF SOCIAL WORK SAFETY DEGREE PROGRAM (M.S.) GENERAL EDUCATION (GM) If programs are listed above, will this change affect the Catalog and Advising Reports for those programs? If so, have Form 2's been submitted for each of those programs? (Form 2 is necessary to provide updates to the Catalog and Advising Reports) NA Yes They will be submitted in the future 1 Proposal Information: I. (Procedures for form #4A) Detailed explanation of changes (use FROM/TO format) FROM: MATH 230 – Introductory Statistics A pre-calculus course in statistics. Descriptive statistics, probability distributions, prediction, hypothesis testing, correlation, and regression. This course does not count towards a mathematics major or minor in either liberal arts or secondary education or towards a mathematics minor in elementary education. This course may not be taken for credit if credit has been or is being earned in any other statistics course. Prereq: Waiver or a grade of C or better in MATH 141. Unreq: Any other statistics course. TO: MATH 230 – Introduction to Statistical Reasoning and Analysis A course on the principles, procedures and concepts surrounding the production, summarization and analysis of data. Emphasis on critical reasoning and interpretation of statistical results. Content includes: probability, sampling, and research design; statistical inference, modeling and computing; practical application culminating in a research project. Unrequisite: ECON 245, PSYCH 215, SOCIOLOGY 295. Prereq: Grade of C or better in Math 141 or permission of instructor. II. Justification for action The Department of Mathematical and Computer Sciences has essentially three courses that are an Introduction to Statistics. Two of these classes, Math 230 and Math 231, are service courses. We are updating our curriculum based on advances in statistics education and recommendations from the LEAP initiative. We are moving the MATH 230 course focus away from formulas and computations, toward statistical concepts and reasoning, critical thinking about data and data analysis. The class will have hands on data analysis components and projects. At the same time, we wish to consolidate MATH 230 and 231 into one course, Math 230-Revised, for efficiency and cost savings. Programs affected by this change will be advised to have their students enroll in the revised MATH 230 course to be renamed, Introduction to Statistical Reasoning and Analysis. III. Syllabus/outline (if course revision, include former syllabus and new syllabus) The revised course syllabus and an example course project description can be found below. Please see accompanying former syllabi. 2 Introduction to Statistics – MATH 230 – Spring 2013 MWF 12:05-12:55pm – McGraw Hall Room 125 Instructor: Office: Office Hours: Text: Prerequisite: Phone: E-mail: William T. Mickelson 2225 Laurentide Hall MWF from 11:00–12:00; M 2:15-4:15; or by appointment Essential Statistics by David Moore A grade of C or better in Math 141, or waiver. A student may not register for any course which is a pre-requisite for another course in which credit has been earned unless prior departmental approval is obtained. (office): 262-472-5169 (home): 608-233-1884 I do have young children, so please be considerate and do not call my home phone after 9:00pm or before 7:00am. mickelsw@uww.edu (please put MATH 230 in the subject line) I check email daily during the semester and email is the preferred form of communication. Please note: email is NOT an instantaneous form of communication. You need to allow/plan at least 24 hours for a return email. TEACHING PHILOSOPHY I feel it is important for you to have an understanding of my teaching philosophy and the objectives I have for this introductory statistics course. My philosophy of teaching is based on two fundamental beliefs I hold about the purpose of education and the role of the teacher and student in the learning process. First, the primary aim of education is to help students develop their intellect and use their minds well. This means that you will be asked to develop ways of thinking that you may not have been exposed to in the past. Second, I recognize that each student brings to the classroom unique prior experiences, knowledge, and learning styles. It is my responsibility as an educator to help bridge the gap between you and the subjectmatter of this course in a way that is meaningful for all students. It is your responsibility as a student to actively participate in the learning process and allow yourself the opportunity to learn. This means: being in class, being prepared for class by reading ahead of time, participating in class discussions, doing the experiments and data collection activities, attempting to interpret the results of our activities and assignments, and draw conclusions from data there by creating knowledge for yourself and others. By doing this you will construct for yourself an understanding of statistics that is deep enough to apply statistical reasoning on problems you are interested in, and to critique other people’s statistical arguments. RATIONALE FOR STATISTICS AS A TOPIC TO STUDY AND THE METHOD OF INSTRUCTION IN THIS CLASS Our society is rapidly gaining easy access to, and becoming dependent upon, ever increasing amounts of data and information. The knowledge and skills necessary to process, analyze and interpret this information/data are more important today than ever before. With this reliance on data comes a serious responsibility for all people to be educated in the basic principles and procedures of statistical reasoning. In addition, it is important for all members of our society to fully understand the extent to which statistical reasoning influences policy decisions, frames debates, informs business decisions, helps to evaluate quality of services and products, guides research, and sheds light on controversial topics. From an educational perspective, attaining statistical reasoning abilities implies that the student develop critical thinking skills about how data is obtained, summarized, and used. The teaching methods used in this class are designed to help you develop critical thinking skills about reasoning with data. Any teaching method, 3 however, is not sufficient to ensure learning. You as the student must be actively involved in the process as well. After about 25 years of study, debate, and argument, The American Statistical Association (ASA) and the Mathematics Association of American (MAA) Joint Curriculum Committee have developed a set of general guidelines for how the introductory statistics course should be taught. The ASA and MAA advocate: an increased emphasis on the elements of statistical thinking (i.e. the need for data, the importance of data production, the omnipresence of variability, the measuring and modeling of variability). the incorporation of more data and concepts, fewer recipes and derivations. Wherever possible, automate computations and graphics. An introductory course should: a) rely heavily on real (not merely realistic) data; b) emphasize statistical concepts; c) rely on computers rather than computational recipes; d) treat formal derivations as secondary in importance. active learning through the following alternatives to lecturing: a) group problem solving and discussion; b) laboratory exercises; c) demonstrations based on class-generated data; d) written and oral presentations; and e) projects. In other words, these recommendations call for activity-based learning using real data focused on promoting the learning of statistical concepts and the development of statistical reasoning abilities. This class will be taught consistent with these general guidelines. COURSE FRAMEWORK AND LEARNING OBJECTIVES Applying these general principles to the teaching of statistics gives rise to my objectives for this course. I would like you to understand statistics as: a process of gathering evidence to increase our understanding of the world (there are right ways and wrong ways to do this and we must delineate the differences), a method of problem-solving, and a way to help make decisions in the face of variability and uncertainty. There are five general steps to statistical reasoning. These are: a) posing interesting and meaningful inquiry questions that can be addressed quantitatively, b) designing a study to address the inquiry question, c) collecting data, d) summarizing and analyzing the data, and e) drawing conclusions from the data. It is my opinion that a firm understanding of these topics and how they should be carried out is utterly essential for any educated person. Ultimately, the goal is for you to become a critical and informed consumer as well as producer of numerical information and argument. With this in mind, my main learning objectives are that you: 1. develop an in-depth conceptual understanding of basic statistical and probabilistic concepts, ideas and principles, as well as how they are related and interconnected. 2. can demonstrate the ability to apply the tenets of correct statistical reasoning in applied situations and correctly interpret results. 3. develop basic statistical computing and data analysis skills. 4. develop the ability to correctly interpret statistical computer printout. 5. demonstrate a correct understanding of statistical formulas and notation. 6. develop an awareness of the prevalence of the use of statistics in our society and a positive outlook toward statistics and their uses. 4 OUTLINE OF COURSE Reasoning with data, the application of statistical principles and procedures, is a non-linear process. Even though there are five general steps to statistical reasoning, one must always be looking ahead and revisiting past decisions to fully understand the context of the study and draw valid conclusions. The class will start with basic probability; move to the intricacies of research design, data collection, and exploratory data analysis; then end with a focus on statistical inference including such topics as: sampling distributions, confidence intervals and hypothesis tests. Statistical principles, procedures, and concepts will be stressed through the course materials, activities and discussions. How to reason, from a statistical perspective, will be modeled through out the course. Chapters covered during the three primary course units, they are: I) Probability: Chapters 9, 3, 11 and 12 II) Producing, Organizing and Describing Data: Chapters 7, 8, 1 and 2 III) Analyzing Data a. Statistical Inference and Confidence Intervals: Chapters 10, 13, 14, 16 and 18 b. Correlation and Regression: Chapters: 4, 5 and 22 c. Contingency Tables and Chi-Square Tests: Chapters 21 COURSE REQUIREMENTS Attendance Participation Completion of assigned reading Completion of course assignments Mid-term examinations Completion of a project with written report and oral presentation Attendance and Participation This class will look and feel like an evolving on-going discussion with each class period building on previous experiences. Unlike most math classes, this class has a large number of difficult concepts/ideas that you will need to fully understand and be able to work with. It will not be possible for you to understand and internalize the statistical vocabulary, concepts, ideas, and mode of reasoning, or successfully apply them without being in class and actively participating in all of the class activities and discussions. Furthermore, if you do miss class, it will not be easy to catch up. Don’t miss class! As a formal class policy, attendance and participation is required. Students with excused absences, which include university sponsored events/activities, or medical or family emergencies (documentation required), will be considered in attendance. Evidence of repeated unexcused absences will be addressed consistent with the University of Wisconsin-Whitewater polices and applied on an individual basis. Excessive (more than 5) unexcused absences will result in failure for the course, regardless of exam performance. Assigned Reading The sections and chapters of the textbook will be used as a supplement to what occurs during class. This class will NOT necessarily follow the textbook chapter by chapter. The specific reading assignments will be given during class. You are required to read what is assigned. Examinations will cover content from chapters and sections assigned as reading, whether or not the specific topics are covered during 5 class time, plus class time presented additional materials. In other words, you are responsible for all assigned reading materials and course content. Course Assignments You will be responsible for completing various course assignments. These assignments range from helping you to understand a statistical concept or idea, developing technical skills, advancing the completion of your course project (see below), or applying what you’ve learned to become a critical consumer of research. You can expect to complete approximately 6 assignments for a total of 60 points toward the final course grade. The instructor reserves the right to change the number of assignments and point totals, depending on course events. Examinations You will be responsible for three examinations, one exam at the end of each primary course unit. Each exam will be worth 100 points toward the final course grade. The exams will be given on the dates given below. Mid-Term Exam #1: Friday, February 15th Mid-Term Exam #2: Friday, March 15th Mid-Term Exam #3: Friday, April 29th The format for these exams will be discussed during class. Please note, examination dates may be changed if there is a substantive change to the schedule. Exam dates specified during class take precedence over the exam dates given in this syllabus. Make-up examinations are only allowed for catastrophic situations and sanctioned UWW events only. Catastrophic events include: severe illness requiring hospitalization and death of family members. You must obtain permission for a make-up examination prior to the examination date. Missing an examination for an un-excused reason will result in a score of 0 for that examination. Project: Written Report and Presentation As the cornerstone for this class, you must complete an analysis project on a topic of your choice. Most likely, your project will be a survey, where you design and conduct the study, collect and analyze the data, and interpret and document your results. There are, however, other possibilities. The purpose of the project is for you to gain hands on experience addressing a problem quantitatively. In other words, you will address a problem by thinking a statistical study through from beginning to end, appropriately applying the principles and procedures you have learned during the semester. For this project you must: outline the problem, design the study, conduct the data collection, perform the data analysis, make your interpretation, summarize your findings, and communicate those findings to others. I expect this project to be an on-going activity, continuously worked on throughout much of the semester. If you only work on this project during the last week of the semester, you may expect a deduction in points. You may work in groups of up to 3 people. In the past, project topics have included: comparisons of clientele at local coffee shops; attitudes toward deer hunting, water management policy, range management policy, the impact of university policies on students, evaluation of the UWW climate on controversial topics, support for new public libraries and community centers, utilization of sporting/exercise facilities, beliefs in UFOs and ghosts, beliefs about government conspiracies, attitudes toward capital punishment, attitudes toward UWW Teacher Evaluations, and a whole host of other topics. You are only 6 limited in topic selection by your own inquisitiveness and the social acceptability of the topic. If you need help coming up with a topic or need consultation during the project, please stop by and see me. Also, to reinforce the true public nature of research and knowledge, you will be responsible for a written project report and an oral presentation summarizing your findings. The format for your presentation will be like a poster session commonly held at national professional conferences, like AERA, MAA or ASA. Your presentation will occur during our final examination period, 3:15 – 5:15pm on Monday, May 13th, 2013. During the first few weeks of class you will receive a handout regarding the project timetable, report due date, project requirements, presentation format, presentation location, and evaluation criteria (i.e. how your letter grade will be assigned). The written report will be worth 100 points and the oral presentation will be worth 50 points toward the final course grade GRADE DETERMINATION: Your grades will be determined by your performance on the mid-term exams, assignments, project report, oral presentation and class attendance/participation. There are a total of approximately 510 possible points. Regardless of the total number of points possible, grades will be assigned based on the following scale: 94 - 100% A 90 – 94% A86 - 89% B+ 80 - 85% B 76 - 79% C+ 70 - 75% C 66 - 69% D+ 60 - 65% D Below 60% F Percentages are rounded down. For example, a percentage of 84.6 will be considered an 84 for the purposes of assigning a course grade. In other words, students must exceed the minimum percentage for that grade to be awarded. Minus grades may be used at the discretion of the instructor to the benefit of the student and based on extenuating circumstances. ADDITIONAL COMMENTS Pagers, cell phones, class behavior: Please turn off all cell phones and pagers before coming to class. Behave in a manner appropriate to a classroom environment. This means being punctual and being respectful of both students and the instructor. Any cell phone use, texting, reading of newspapers, or working on assignments for other classes during class time will be considered rude and disrespectful behavior. In such situations, commensurate deduction of participation points will occur. Time outside of class: "The UW System standard for work required per credit is that students are expected to invest at least 3 hours of combined in-class and out-of-class work per week for each academic unit (credit) of coursework; thus, a 3-credit course will typically require a minimum of 9 hours of work per week (144 hrs./semester)." Questions – Concerns: If at any time you have problems, concerns, or questions about this course do not hesitate to speak with me. Email is the easiest way to get in touch with me, but we can certainly make other arrangements if you cannot make my office hours. I truly want this course to be a positive, enjoyable, and 7 useful experience for you. This will come about most easily if you resolve yourself to being a thoughtful, active participant in the learning process. The more you put into this class the more you will get out of it. Policies: The University of Wisconsin – Whitewater is dedicated to a safe, supportive and nondiscriminatory learning environment. It is the responsibility of all undergraduate and graduate students to familiarize themselves with University policies regarding Special Accommodations, Misconduct, Religious Beliefs, Discrimination, and Absence for University Sponsored Events. (For details please refer to the Undergraduate and Graduate Timetables; the “Rights and Responsibilities” section of the Undergraduate Bulletin; the Academic Requirements and Policies and the Facilities and Services sections of the Graduate bulletin; and the “Student Academic Disciplinary Procedures” [UWS Chapter 14]; and the “Student Nonacademic Disciplinary Procedures” [UWS Chapter 17]) 8 PROJECT DOCUMENTATION AND EVALUATION CRITERIA MATH 230 – Mickelson As the cornerstone for this class, you must complete a data analysis project. The purpose of the project is for you to address a problem through the use of numerical data and statistical analyses. In other words, this project offers you the opportunity to experience how to address a problem by thinking a study through from beginning to end, appropriately applying the statistical principles and procedures you have learned during the semester. For your project you may work alone or in groups of up to three people. It is your responsibility to equally distribute the workload. You will have the opportunity to self evaluate your paper and presentation as well as to evaluate your partners in terms of their performance and contribution. Grades will not necessarily be equally given to all group members. To successfully complete this project, you must: 1. Identify a problem and pose a researchable question: First you need to decide what it is that you are going to study. There are very few limitations on the topic you choose. The only real limitation is your imagination and/or interests. In the past project topics have included: comparisons of clientele at local coffee shops, attitudes towards hunting, impact of changes on Greek alcohol policies, support for new public libraries and community centers, utilization of sporting/exercise facilities, beliefs in UFOs and ghosts, comparison of preferences and quality of local pizza products, student satisfaction or experiences with instruction, evaluation of the effectiveness of UWW programs, and a whole host of other topics. Once you have identified a problem, you need to pose a researchable question that can be addressed or answered by way of obtaining numerical data. Part of your grade stems from the quality of your research question so put some time into the question posing aspect of this project. 2. Design your study: Once you have your question well in hand, you can begin to design how you are going to conduct your study and collect your data. Designing your study consists of deciding on how you will obtain your sample, what questions you will ask, creating a questionnaire or other measuring devices, and how you will physically obtain your data. Remember, that statisticians try to be as objective as possible, to this end you need to control and account for possible sources of bias or confounding. Also, the type of variable you measure dictates the type of analysis you will do so don’t take the outcome measures for granted. During this phase, you should be thinking ahead about how you will be able to analyze your data once your have acquired it. It is a real pain getting data and finding out you can’t do anything with it. Specifically, you should plan what type of test you would run, what you expect to see as the results, how you would interpret the best case and worst case scenarios. Also, you should think about what problems you might encounter and how you could be proactive to prevent them. 3. Collect the data: Next you need to physically conduct the study you designed and collect data. This can be a very time consuming step. You should plan on being done collecting data by the end of March to mid-April. 4. Analyze the data: This step is the reward for the hard thinking that went into step 2. Once you have collected your data you will need to enter it into SPSS. All your analysis will be done on SPSS. NO EXCEPTIONS! At a minimum, you should do some basic exploratory data analysis and then conduct the specific tests you planned in step 2. 9 5. Interpret the results, summarize findings, and offer recommendations: Simply conducting a statistical test is not sufficient, you also need to tell what that result means relative to the context of your problem. Furthermore, you should offer an elaboration on the implications of that result and make recommendations. In other words, you need to explain to someone who is interested in your topic what you learned about that topic and why it is important/interesting. WRITTEN REPORT: In order to document the findings of your project and to promote your professional development, you will submit a written report summarizing your project and findings. Your report should have the following format: 1. An introduction section that describes the problem you are addressing, gives background information on the topic, and discusses why this particular topic is of interest or importance to you. 2. A methods section that describes completely and in detail how you designed your study and what you did to obtain your data. Any questionnaire you develop should be included in an appendix. If you obtain a database from someone else, you need to report your data critique here. 3. An analysis section that reports the results of any statistical tests you perform. It is only necessary to report the type of test that was run, p-values, and interpretation of the test results. Any technical information you wish to include should be put into an appendix. 4. A discussion section that synthesizes the results from all the statistical tests you conducted with how you obtained your data, to form an overall conclusion or recommendation. This is the “story” that is told through your data. 5. A reflection section where you discuss what you would do differently if you were to do this project again and what new questions arose as a consequence to your project. Overall, the paper should be as long as you need it to be to fully document what you did for your project, your analyses, conclusions, and recommendations. In the past, papers have ranged from 5 to 40 pages. Due Date: Your project report can be turned in at any time during the remainder of the semester, but is due no later than our scheduled final exam day and time. EVALUATION AND GRADING OF ANALYSIS PROJECT: We will use a point system to evaluate the quality of your analysis project report. The possible point values and descriptions of what will be looked for in each section are listed in the evaluation form low. If you feel this method of assessment is not sufficient to evaluate your paper, feel free to suggest other categories and we will adopt changes. Letter grades, A, B, C, ..., will be assigned based on a traditional 90%, 80%, 70% scale. 10 EVALUATION FORM FOR DATA ANALYSIS PROJECT AREA TOTAL POINTS YOUR SCORE QUALITY OF RESEARCH QUESTION 10 Nature of research question indicates an genuine attempt to apply statistical concepts and ideas to real problems of interest. SECTION 1: INTRODUCTION Clear concise statement of topic and problem. Is your project practical and relevant for both yourself and of interest to others? 10 SECTION 2: METHODS 20 Study is designed consistent with statistical principles and procedures that ensure internal and external validity. Writing indicates conceptual understanding of statistical ideas and correct application. SECTION 3: ANALYSIS Statistical analyses are conducted appropriately. Analyses are sufficient to address the posed research question. 20 SECTION 4: DISCUSSION The message resulting from the analysis is clear and concise. It addresses and answers the proposed research question in a logical fashion consistent with the statistical evidence presented. 20 SECTION 5: REFLECTION Evidence of serious reflection and thought on strengths and weakness of your study. Outlines what should be done differently in future projects of a similar nature. Articulation of lessons learned. 10 PROFESSIONAL PRESENTATION Project report is professionally presented free from technical writing errors. Project report could be presented to a future employer as an example of your writing and technical skills. 10 TOTAL POINTS: 100 YOUR SCORE: LETTER GRADE: 11 ORAL PRESENTATION: Furthermore, to reinforce the true public nature of research, you will be responsible for giving a poster presentation on your project during our final exam date and time. Your poster should be made out of poster-board which is available at the bookstore. Electronic Power Point Presentations are NOT acceptable. Your poster should present and summarize the topic and results of your project. You are free to use graphics, your art work, charts, PowerPoint slides, or written statements to convey your message. The purpose of the poster is to give you some visual aid in presenting what you have accomplished with your project. It should cover the topic and main questions you tried to address, how you designed your study and obtained data, graphics the depict your results/findings, and your conclusion/recommendations. You are required to give your presentation at your scheduled time. We will be using a poster exhibition session format similar to those used at national conferences. Multiple presentations will be going on simultaneously, over approximately four different sessions. You will have approximately 25 minutes for your presentation. The details on how the session will be run will be discussed during class, closer to the presentation date. 12 PEER REVIEW AND EVALUATION OF PROJECT PRESENTATIONS MATH 230 – Mickelson Name(s) of Presenter(s): The purpose of this rubric is for you to be able to evaluate other student’s presentations. For each criteria (row), enter your comments under the heading you think best describes the quality of the presentation. Your comments should address why you selected that level of quality(column). QUALITY CRITERIA Yes Yes, but ... No, but ... VisualPresentation Is the poster constructed in a professional manner? - logical format? - visually pleasing? Oral Presentation Did the presenters engage the audience and present their project and results in a professional manner? Content of Presentation Did the presenters clearly express the: - purpose? - target population? - how sample was obtained? - type of analysis? - results? - conclusion? Expertise Did the presenters demonstrate expertise with the statistical principles, procedures and methods presented during the past semester of MATH 230? Response to Questions Did the presenters respond to questions in a professional manner? Please write any other pertinent comments on the back of this sheet 13 No 14 15
