107.842
advertisement
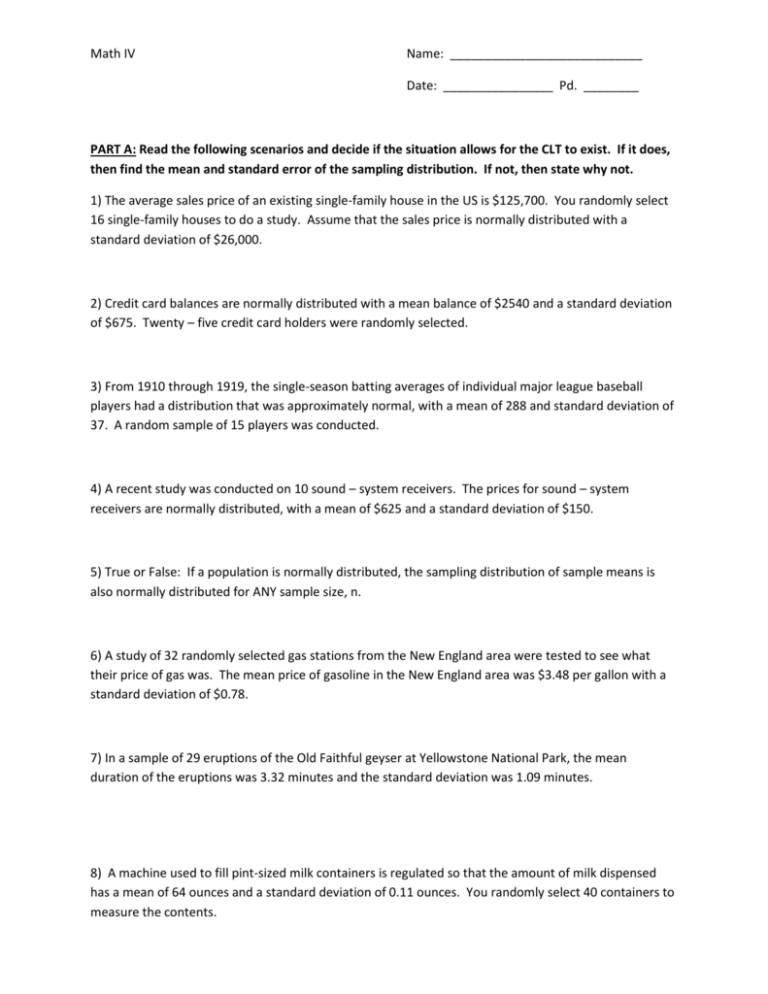
Math IV Name: ____________________________ Date: ________________ Pd. ________ PART A: Read the following scenarios and decide if the situation allows for the CLT to exist. If it does, then find the mean and standard error of the sampling distribution. If not, then state why not. 1) The average sales price of an existing single-family house in the US is $125,700. You randomly select 16 single-family houses to do a study. Assume that the sales price is normally distributed with a standard deviation of $26,000. 2) Credit card balances are normally distributed with a mean balance of $2540 and a standard deviation of $675. Twenty – five credit card holders were randomly selected. 3) From 1910 through 1919, the single-season batting averages of individual major league baseball players had a distribution that was approximately normal, with a mean of 288 and standard deviation of 37. A random sample of 15 players was conducted. 4) A recent study was conducted on 10 sound – system receivers. The prices for sound – system receivers are normally distributed, with a mean of $625 and a standard deviation of $150. 5) True or False: If a population is normally distributed, the sampling distribution of sample means is also normally distributed for ANY sample size, n. 6) A study of 32 randomly selected gas stations from the New England area were tested to see what their price of gas was. The mean price of gasoline in the New England area was $3.48 per gallon with a standard deviation of $0.78. 7) In a sample of 29 eruptions of the Old Faithful geyser at Yellowstone National Park, the mean duration of the eruptions was 3.32 minutes and the standard deviation was 1.09 minutes. 8) A machine used to fill pint-sized milk containers is regulated so that the amount of milk dispensed has a mean of 64 ounces and a standard deviation of 0.11 ounces. You randomly select 40 containers to measure the contents. Part B: Using the proper z * value (use your notes to remember the z values), create a confidence interval for the suggested level of confidence listed below. Use the example below as a guide. Example: A simple random sample (SRS) of 50 Big City University freshmen are collected and given an IQ test. The mean of the sample is 112 and the standard deviation of the population of IQ scores is 15. Create a 95% confidence interval for the TRUE mean IQ score of the population of all Big City freshmen. Step 1: write the formula Step 2: identify parts CI = 𝑥̅ ± 𝑧 ∗ · 𝜎 √𝑛 𝑥̅ = 112 𝑧 ∗ = 1.96 (for a 95% confidence level) 𝜎 = 15 n = 50 Step 3: Plug values into equation: CI = 112 ± 1.96 · Step 4: Using your calculator, evaluate. 15 √50 112 + 1.96 · 112 − 1.96 · 15 √50 15 √50 = 116.158 = 107.842 Step 5: Write your answer as an interval: (107.842, 116.158) Now you try the following: 1) A study was constructed on the mean repair cost of microwave ovens using 5 microwave ovens. Assume a normal distribution with a mean of cost of $75.00 and a standard deviation of $12.50. a) construct an 80% confidence interval b) construct a 90 % confidence interval 2) In a random sample of 10 American adults, the mean waste generated per person per day was 4.3 pounds and the standard deviation was 1.2 pounds. Assume a normal distribution. a) construct a 95 % confidence interval b) construct a 99 % confidence interval


