Estimating Population Mean: Confidence Intervals & Excel
advertisement
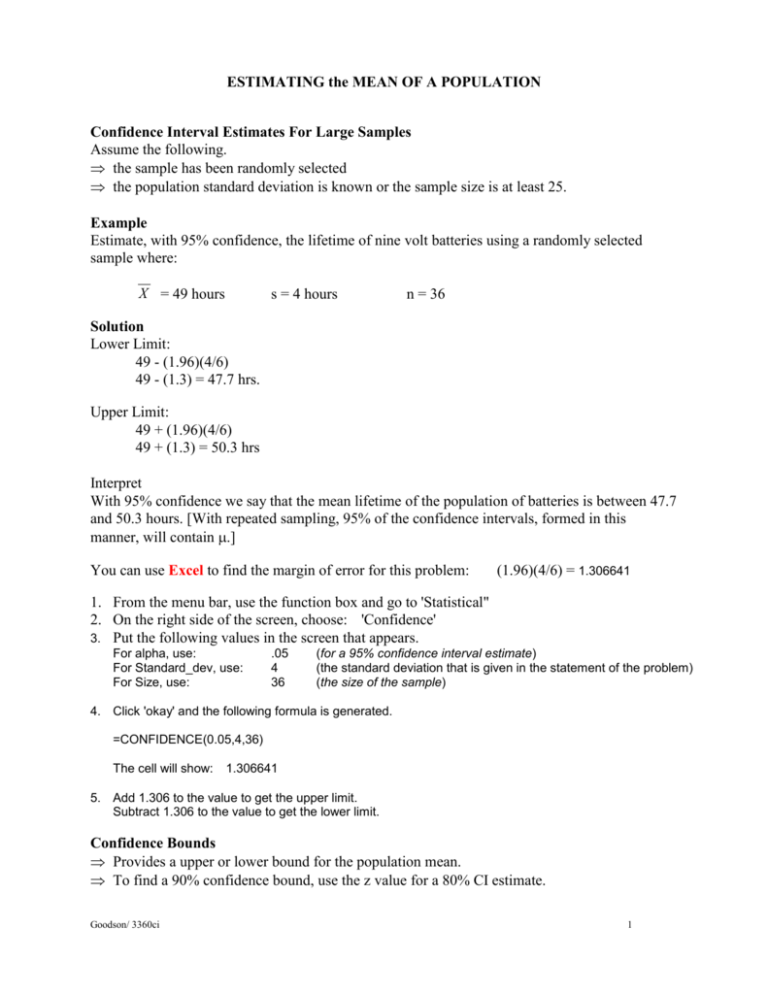
ESTIMATING the MEAN OF A POPULATION Confidence Interval Estimates For Large Samples Assume the following. the sample has been randomly selected the population standard deviation is known or the sample size is at least 25. Example Estimate, with 95% confidence, the lifetime of nine volt batteries using a randomly selected sample where: X = 49 hours s = 4 hours n = 36 Solution Lower Limit: 49 - (1.96)(4/6) 49 - (1.3) = 47.7 hrs. Upper Limit: 49 + (1.96)(4/6) 49 + (1.3) = 50.3 hrs Interpret With 95% confidence we say that the mean lifetime of the population of batteries is between 47.7 and 50.3 hours. [With repeated sampling, 95% of the confidence intervals, formed in this manner, will contain .] You can use Excel to find the margin of error for this problem: (1.96)(4/6) = 1.306641 1. From the menu bar, use the function box and go to 'Statistical" 2. On the right side of the screen, choose: 'Confidence' 3. Put the following values in the screen that appears. For alpha, use: For Standard_dev, use: For Size, use: .05 4 36 (for a 95% confidence interval estimate) (the standard deviation that is given in the statement of the problem) (the size of the sample) 4. Click 'okay' and the following formula is generated. =CONFIDENCE(0.05,4,36) The cell will show: 1.306641 5. Add 1.306 to the value to get the upper limit. Subtract 1.306 to the value to get the lower limit. Confidence Bounds Provides a upper or lower bound for the population mean. To find a 90% confidence bound, use the z value for a 80% CI estimate. Goodson/ 3360ci 1
