Abstract - Figshare
advertisement
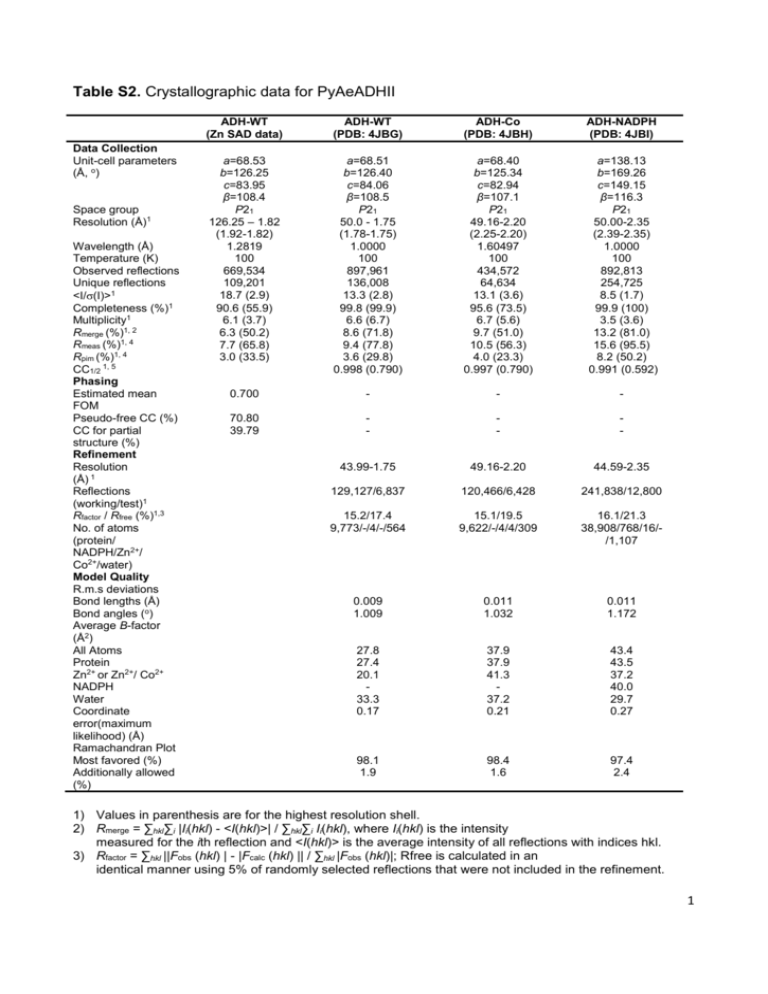
Table S2. Crystallographic data for PyAeADHII Data Collection Unit-cell parameters (Å, o) Space group Resolution (Å)1 Wavelength (Å) Temperature (K) Observed reflections Unique reflections <I/(I)>1 Completeness (%)1 Multiplicity1 Rmerge (%)1, 2 Rmeas (%)1, 4 Rpim (%)1, 4 CC1/2 1, 5 Phasing Estimated mean FOM Pseudo-free CC (%) CC for partial structure (%) Refinement Resolution (Å) 1 Reflections (working/test)1 Rfactor / Rfree (%)1,3 No. of atoms (protein/ NADPH/Zn2+/ Co2+/water) Model Quality R.m.s deviations Bond lengths (Å) Bond angles (o) Average B-factor (Å2) All Atoms Protein Zn2+ or Zn2+/ Co2+ NADPH Water Coordinate error(maximum likelihood) (Å) Ramachandran Plot Most favored (%) Additionally allowed (%) ADH-WT (Zn SAD data) ADH-WT (PDB: 4JBG) ADH-Co (PDB: 4JBH) ADH-NADPH (PDB: 4JBI) a=68.53 b=126.25 c=83.95 β=108.4 P21 126.25 – 1.82 (1.92-1.82) 1.2819 100 669,534 109,201 18.7 (2.9) 90.6 (55.9) 6.1 (3.7) 6.3 (50.2) 7.7 (65.8) 3.0 (33.5) a=68.51 b=126.40 c=84.06 β=108.5 P21 50.0 - 1.75 (1.78-1.75) 1.0000 100 897,961 136,008 13.3 (2.8) 99.8 (99.9) 6.6 (6.7) 8.6 (71.8) 9.4 (77.8) 3.6 (29.8) 0.998 (0.790) a=68.40 b=125.34 c=82.94 β=107.1 P21 49.16-2.20 (2.25-2.20) 1.60497 100 434,572 64,634 13.1 (3.6) 95.6 (73.5) 6.7 (5.6) 9.7 (51.0) 10.5 (56.3) 4.0 (23.3) 0.997 (0.790) a=138.13 b=169.26 c=149.15 β=116.3 P21 50.00-2.35 (2.39-2.35) 1.0000 100 892,813 254,725 8.5 (1.7) 99.9 (100) 3.5 (3.6) 13.2 (81.0) 15.6 (95.5) 8.2 (50.2) 0.991 (0.592) 0.700 - - - 70.80 39.79 - - - 43.99-1.75 49.16-2.20 44.59-2.35 129,127/6,837 120,466/6,428 241,838/12,800 15.2/17.4 9,773/-/4/-/564 15.1/19.5 9,622/-/4/4/309 16.1/21.3 38,908/768/16//1,107 0.009 1.009 0.011 1.032 0.011 1.172 27.8 27.4 20.1 33.3 0.17 37.9 37.9 41.3 37.2 0.21 43.4 43.5 37.2 40.0 29.7 0.27 98.1 1.9 98.4 1.6 97.4 2.4 1) Values in parenthesis are for the highest resolution shell. 2) Rmerge = ∑hkl∑i |Ii(hkl) - <I(hkl)>| / ∑hkl∑i Ii(hkl), where Ii(hkl) is the intensity measured for the ith reflection and <I(hkl)> is the average intensity of all reflections with indices hkl. 3) Rfactor = ∑hkl ||Fobs (hkl) | - |Fcalc (hkl) || / ∑hkl |Fobs (hkl)|; Rfree is calculated in an identical manner using 5% of randomly selected reflections that were not included in the refinement. 1 4) Rmeas = redundancy-independent (multiplicity-weighted) Rmerge[1,2]. Rpim = precision-indicating (multiplicity-weighted) Rmerge[3,4]. 5) CC1/2 is the correlation coefficient of the mean intensities between two random half-sets of data [5,6]. 2 Supplemental References: 1. Evans PR (2011) An introduction to data reduction: space-group determination, scaling and intensity statistics. Acta Crystallogr D Biol Crystallogr 67: 282-292. 2. Evans P (2006) Scaling and assessment of data quality. Acta Crystallogr D Biol Crystallogr 62: 72-82. 3. Diederichs K, Karplus PA (1997) Improved R-factors for diffraction data analysis in macromolecular crystallography. Nat Struct Biol 4: 269-275. 4. Weiss MS (2001) Global indicators of X-ray data quality. Journal of Applied Crystallography 34: 130-135. 5. Karplus PA, Diederichs K (2012) Linking crystallographic model and data quality. Science 336: 1030-1033. 6. Evans P (2012) Biochemistry. Resolving some old problems in protein crystallography. Science 336: 986-987. 3
