The effect of temperature on reaction rate lab
advertisement
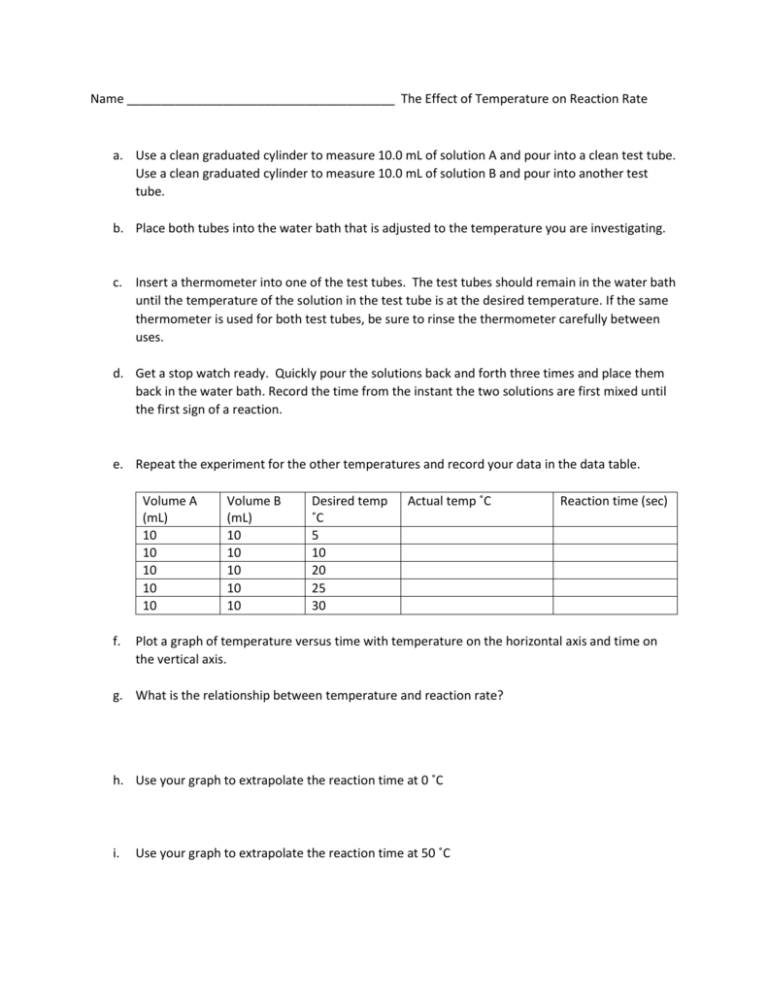
Name _______________________________________ The Effect of Temperature on Reaction Rate a. Use a clean graduated cylinder to measure 10.0 mL of solution A and pour into a clean test tube. Use a clean graduated cylinder to measure 10.0 mL of solution B and pour into another test tube. b. Place both tubes into the water bath that is adjusted to the temperature you are investigating. c. Insert a thermometer into one of the test tubes. The test tubes should remain in the water bath until the temperature of the solution in the test tube is at the desired temperature. If the same thermometer is used for both test tubes, be sure to rinse the thermometer carefully between uses. d. Get a stop watch ready. Quickly pour the solutions back and forth three times and place them back in the water bath. Record the time from the instant the two solutions are first mixed until the first sign of a reaction. e. Repeat the experiment for the other temperatures and record your data in the data table. Volume A (mL) 10 10 10 10 10 f. Volume B (mL) 10 10 10 10 10 Desired temp ˚C 5 10 20 25 30 Actual temp ˚C Plot a graph of temperature versus time with temperature on the horizontal axis and time on the vertical axis. g. What is the relationship between temperature and reaction rate? h. Use your graph to extrapolate the reaction time at 0 ˚C i. Reaction time (sec) Use your graph to extrapolate the reaction time at 50 ˚C
