Plant Hardiness maps for Colorado_wendyedits
advertisement
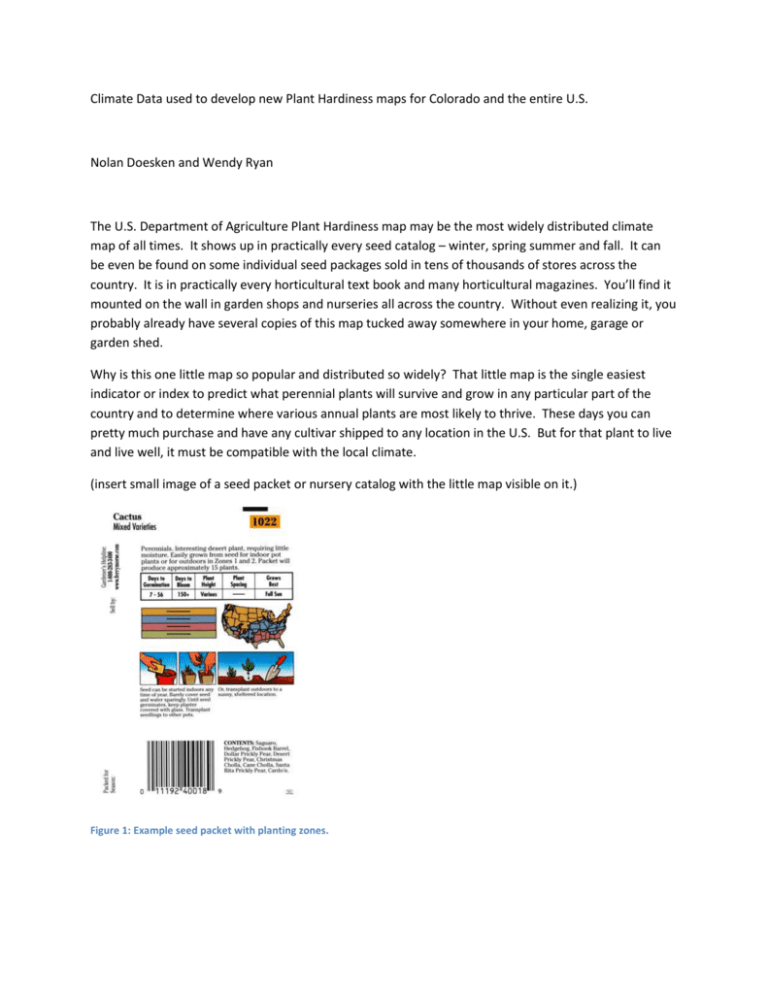
Climate Data used to develop new Plant Hardiness maps for Colorado and the entire U.S. Nolan Doesken and Wendy Ryan The U.S. Department of Agriculture Plant Hardiness map may be the most widely distributed climate map of all times. It shows up in practically every seed catalog – winter, spring summer and fall. It can be even be found on some individual seed packages sold in tens of thousands of stores across the country. It is in practically every horticultural text book and many horticultural magazines. You’ll find it mounted on the wall in garden shops and nurseries all across the country. Without even realizing it, you probably already have several copies of this map tucked away somewhere in your home, garage or garden shed. Why is this one little map so popular and distributed so widely? That little map is the single easiest indicator or index to predict what perennial plants will survive and grow in any particular part of the country and to determine where various annual plants are most likely to thrive. These days you can pretty much purchase and have any cultivar shipped to any location in the U.S. But for that plant to live and live well, it must be compatible with the local climate. (insert small image of a seed packet or nursery catalog with the little map visible on it.) Figure 1: Example seed packet with planting zones. When people see this map, they most likely believe it is based on specific knowledge -- perhaps experiential – of what plants actually do live in each part of the country. But in reality, plant hardiness zones are derived directly from climate data and are not plant specific. In particular, this map is based on just one temperature statistic – and an obscure one at that. That statistic is the average annual extreme minimum temperature. The single coldest temperature observed each year is identified from the daily temperature readings at each available weather station. These annual values are then summed and averaged over a fixed and consistent period of years to give the average coldest temperature. In this case, the averaging period was 1976-2005. Horticulturalists have found that this easy to compute temperature index reasonably defines and distinguishes the various climate zones of the country. For example, many varieties of lilacs thrive in cold climates. Drive up to Gunnison in June and you’ll likely see the town in bloom with lovely purple lilacs. But you’ll never find black sweet cherries growing there. In fact, there are just a few small areas in western Colorado where sweet cherries grow and reliably produce fruit. Figure 2: Newly released USDA Plant Hardiness Zone Map 1976-2005. New Plant Hardiness Map issued in 2012 We were delighted to hear that the Colorado Water Institute was dedicating an issue of their magazine to horticulture this year since a fantastic new USDA Plant hardiness map is hot off the press (actually hot off the computer). It was just released to the public in late January 2012. This is the latest in a series of similar maps. The first was printed back in 1938 and there have been at least 6 updates since then. The latest map is based on climate data from a few thousand weather stations across the U.S. covering the period 1976-2005. This supersedes the previous map that has been in use since 1990 that was based on only a 13-year period of 1974-1986. The period for this latest maps already seems a bit out of date, but it literally took 6 years to complete the analysis, publish the results, complete a comprehensive peer review process both within and outside the USDA and finally share the information publically. It has taken nearly 2 years just to develop the website and web services to accommodate the millions of users. (http://planthardiness.ars.usda.gov/PHZMWeb/) Most of the early versions of these maps were hand drawn, smoothly interpolated, and based on only a subset of the available historical climate data from NOAA (the National Oceanic and Atmospheric Administration). However, the significance of this map (both horticulturally and economically) has become so great in recent decades that the U.S. Department of Agriculture selected the PRISM Climate Group at Oregon State University to lead this latest mapping effort. The Colorado Climate Center has worked with Chris Daly and his PRISM group on various projects for nearly 20 years and they are the premier climate mappers especially for mountainous areas. They went all out on this new horticultural application -- using literally thousands of weather stations with many years of daily temperature data. PRISM climate analysis and mapping techniques developed over the past 20 years were applied that deal particularly well with climate variations in mountains areas and other regions with complex topography (Daly, et al., 2012). By using more data and more advanced mapping capabilities, a finer resolution map was possible. Instead of the traditional 8 hardiness zones often shown in seed catalogues, the new map has a total of 13 zones and each of these are split in half (a and b) to give a total of 26 plant hardiness zones. This allows full delineation all the way from the coldest parts of Alaska to the warmest portions of Hawaii and south Florida. What is particularly exciting about this latest Plant Hardiness Map is that for the first time it is not just a static map image but an interactive website where anyone can select their specific part of the country and zoom right into their own neighborhood (http://planthardiness.ars.usda.gov/PHZMWeb/). We are especially pleased with this new map product since the Colorado Climate Center at CSU had ample opportunity to review the input climate data, the methodologies and the subsequent map analysis well in advance of this public release. We are impressed with this work and it is already serving many needs. Zones present in Colorado include 3a to 7a. The average annual extreme minimum temperatures associated with these zones are shown in Table 1. Table 1: Average Extreme Minimum Temperatures associated with plant hardiness zones. Zone 3a 3b 4a 4b 5a 5b 6a 6b 7a Average Extreme Minimum Temperature (F) -40 to -35 -35 to -30 -30 to -25 -25 to -20 -20 to -15 -15 to -10 -10 to -5 -5 to 0 0 to +5 Figure 3: USDA Plant Hardiness Zone Map for Colorado, 1976-2005. Never before have we seen such detail. For example, the warm spots in the Denver-Boulder area (a combination of prevailing wintertime downslope warming winds at the base of the Flatirons and the urban heat island that has developed near central Denver in recent decades). The milder areas of the Arkansas Valley in southeastern Colorado are also clearly delineated including what the locals have always called “the banana belt” in the upper Arkansas from Salida to Buena Vista. Of particular interest is our traditional fruit growing region of west central Colorado. Not surprisingly, it shows up nicely on these new maps. As expected, the mildest area (Plant Hardiness zone 7a) encompasses the Palisade area where the bulk of Colorado’s peaches and wine grapes are grown and it wraps part way around the base of the amazing Grand Mesa that towers over the valley. But what is interesting is the band of milder temperatures found south of the Colorado River and West of the Gunnison River at the base of the northern edge of the Uncompahgre Plateau including portions of the Colorado National Monument. Climatically, that area may have also had high potential for fruit production but with one notable exception, mild temperatures are not the only thing needed. A reliable water supply and appropriate soils are also essential and this combination was limited in those areas south of Grand Junction. Please take time to study these maps as they contain a great deal of interesting climate information. Also remember, that this temperature indicator is NOT the same as average temperature. We know, for example, that the coldest average temperatures are found as you increase in elevation. However, the coldest individual low temperature extremes normally occur in high mountain valleys where the heavier, denser cold air gathers in the low spots. This can clearly be seen in the San Luis Valley in south central Colorado surrounding Alamosa. Are plant hardiness zones changing? The release of the new plant hardiness maps in late January stirred quite a debate in the national media. The new maps showed that for much of the country zones had shifted about ½ category towards the next milder zone. Is this an indication of climate change in action that may already be affecting plants? Well, let’s take a look at some Colorado data to see for ourselves. The figure below shows time series of annual extreme minimum temperatures from 1961 – 2011 for three sites traversing our state from east to west: Denver-Stapleton, Lake Dillon and Montrose. This graphic illustrates that over the past 50 years, our annual extreme minimum temperatures just aren’t what they used to be. The trend lines show the mountains and western slope increasing by about +0.2 degrees per year and +0.1 degree per year at the Stapleton station. It is interesting however, that in 2011 all three stations set the lowest annual minimum since 1990 in an early February cold snap. The moral of the story is that even though we see a trend toward warmer extreme minimums, that doesn’t mean we won’t see those temperatures ever again, just as 2011 proved true. References: Daly, Christopher, Mark P. Widrlechner, Michael D. Halbleib, Joseph I. Smith, Wayne P. Gibson, 2012: Development of a new usda plant hardiness zone map for the united states. J. Appl. Meteor. Climatol., 51, 242–264. doi: http://dx.doi.org/10.1175/2010JAMC2536.1
