Rate of the Reaction of Magnesium with Acid
advertisement
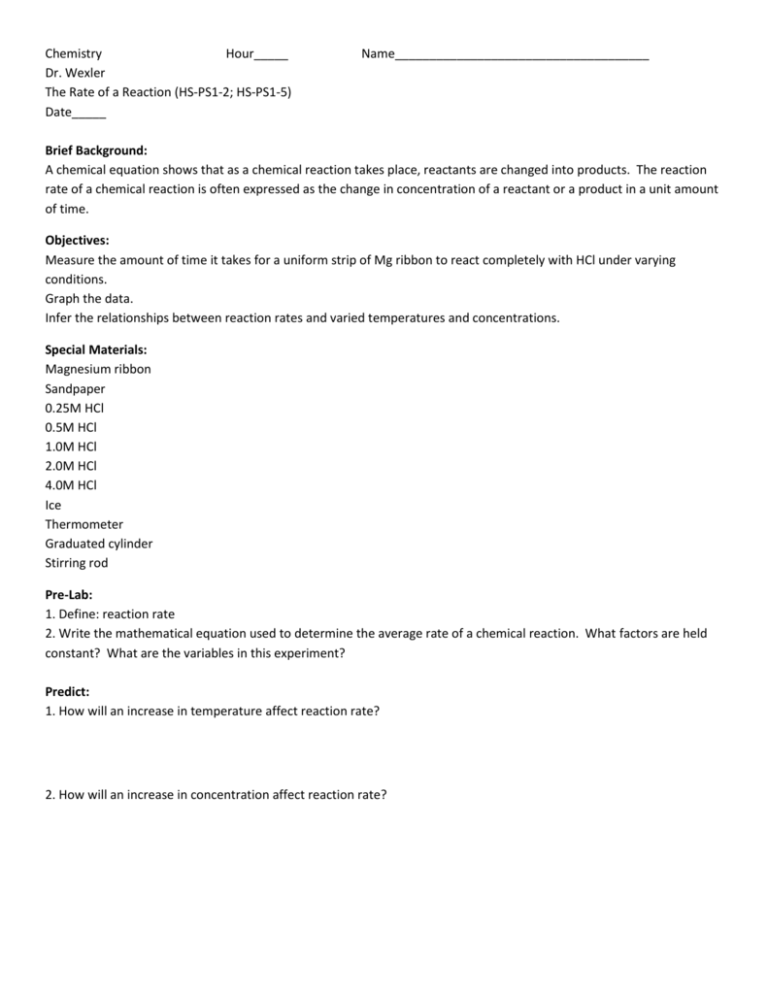
Chemistry Hour_____ Dr. Wexler The Rate of a Reaction (HS-PS1-2; HS-PS1-5) Date_____ Name_____________________________________ Brief Background: A chemical equation shows that as a chemical reaction takes place, reactants are changed into products. The reaction rate of a chemical reaction is often expressed as the change in concentration of a reactant or a product in a unit amount of time. Objectives: Measure the amount of time it takes for a uniform strip of Mg ribbon to react completely with HCl under varying conditions. Graph the data. Infer the relationships between reaction rates and varied temperatures and concentrations. Special Materials: Magnesium ribbon Sandpaper 0.25M HCl 0.5M HCl 1.0M HCl 2.0M HCl 4.0M HCl Ice Thermometer Graduated cylinder Stirring rod Pre-Lab: 1. Define: reaction rate 2. Write the mathematical equation used to determine the average rate of a chemical reaction. What factors are held constant? What are the variables in this experiment? Predict: 1. How will an increase in temperature affect reaction rate? 2. How will an increase in concentration affect reaction rate? Procedure: Measure and record the mass (in mg) of a 0.5cm strip of sanded magnesium. Prepare 9 strips having the same mass. Part A: Effect of Temperature 1. Pour 10mL of 1.0M HCl into a test tube. 2. Place the test tube in a 250mL beaker containing ice water. 3. Wait 3 minutes, then measure and record the temperature of the acid. 4. Add a 1cm strip of magnesium ribbon to the acid and start the timer. Stir to keep the magnesium completely submerged throughout the reaction. 5. Record the time required for the magnesium to react completely. 6. Immediately record the final temperature of the acid. 7. Repeat at room temperature, 50°C and in boiling water. Part B: Effect of Concentration 1. Add 10mL of 4.0M HCl to a test tube. 2. Place the test tube in a 250mL beaker containing water at room temperature. 3. Place a 1cm strip of magnesium into the acid and start the timer. Keep the magnesium submerged. 4. Record the time required for the magnesium to react completely. 5. Repeat with 2.0M, 1.0M, 0.5M, and 0.25M HCl. Results: Your data tables should look like the following: Tube 1 2 3 4 Tube 1 2 3 4 5 Initial Temp (°C) Part A: Effect of Temperature on Reaction Rate Final Temp (°C) Average Temp (°C) Reaction time (s) Part B: Effect of Concentration on Reaction Rate Acid Concentration Reaction time (s) Reaction rate (mg/s) Reaction rate (mg/s) Analysis: 1. Why was it necessary to sand the magnesium? 2. Why is the volume and concentration of the acid kept constant in Part A? 3. What effect does temperature have on reaction rate? 4. Was the beaker of water successful in maintaining a constant temperature in the reaction tube in Part A? Explain. 5. Why are the trials in Part B carried out in a beaker of room temperature water? 6. What effect does concentration have on reaction rate? Graphing: Prepare your graphs in Excel 1. Make a graph of temperature vs. time. 2. Make a graph of concentration vs. time Based on your graphs, are the relationships linear or non-linear? Use your graphing calculator to determine the best fit equations for each of the two sets of data. Part A: Temp vs. time Part B: Conc. vs. time Research Questions: 1. What effect does acid rain have on the rate of corrosion of materials used in buildings, automobiles, and statues? How can the concentration of the acid in the rain, and thus the rate of corrosion be controlled? 2. Explain why refrigerated or frozen foods do not spoil as quickly as those left at room temperature. 3. For centuries the production and destruction of ozone in earth’s ozone layer was constant. Explain why in recent decades the ozone has been shown to be depleted in certain areas faster than it is replaced.
