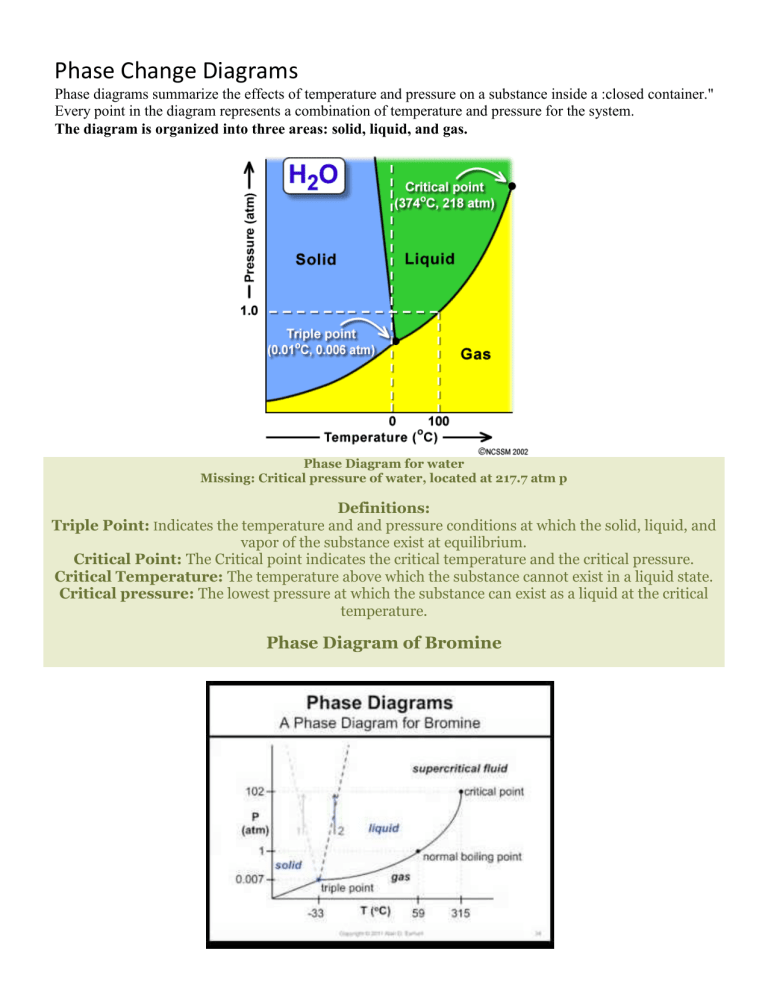
Phase Change Diagrams Phase diagrams summarize the effects of temperature and pressure on a substance inside a :closed container." Every point in the diagram represents a combination of temperature and pressure for the system. The diagram is organized into three areas: solid, liquid, and gas. Phase Diagram for water Missing: Critical pressure of water, located at 217.7 atm p Definitions: Triple Point: Indicates the temperature and and pressure conditions at which the solid, liquid, and vapor of the substance exist at equilibrium. Critical Point: The Critical point indicates the critical temperature and the critical pressure. Critical Temperature: The temperature above which the substance cannot exist in a liquid state. Critical pressure: The lowest pressure at which the substance can exist as a liquid at the critical temperature. Phase Diagram of Bromine
