EXPERIMENT #3
advertisement
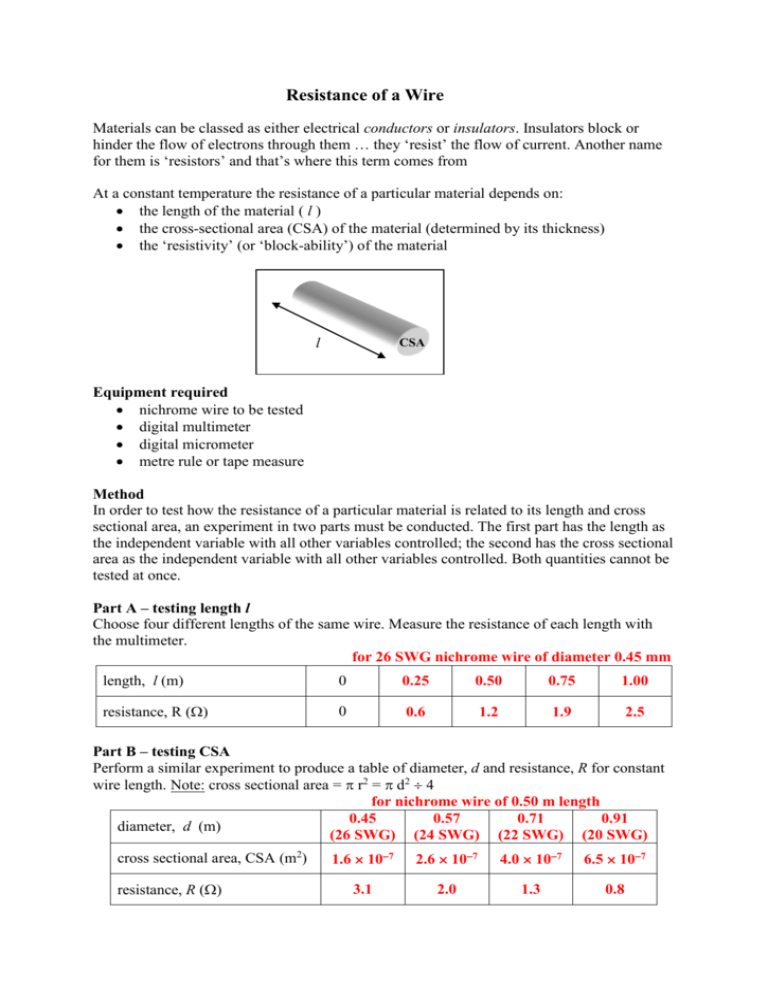
Resistance of a Wire Materials can be classed as either electrical conductors or insulators. Insulators block or hinder the flow of electrons through them … they ‘resist’ the flow of current. Another name for them is ‘resistors’ and that’s where this term comes from At a constant temperature the resistance of a particular material depends on: the length of the material ( l ) the cross-sectional area (CSA) of the material (determined by its thickness) the ‘resistivity’ (or ‘block-ability’) of the material l CSA Equipment required nichrome wire to be tested digital multimeter digital micrometer metre rule or tape measure Method In order to test how the resistance of a particular material is related to its length and cross sectional area, an experiment in two parts must be conducted. The first part has the length as the independent variable with all other variables controlled; the second has the cross sectional area as the independent variable with all other variables controlled. Both quantities cannot be tested at once. Part A – testing length l Choose four different lengths of the same wire. Measure the resistance of each length with the multimeter. for 26 SWG nichrome wire of diameter 0.45 mm length, l (m) 0 0.25 0.50 0.75 1.00 resistance, R () 0 0.6 1.2 1.9 2.5 Part B – testing CSA Perform a similar experiment to produce a table of diameter, d and resistance, R for constant wire length. Note: cross sectional area = r2 = d2 4 for nichrome wire of 0.50 m length 0.45 0.57 0.71 0.91 diameter, d (m) (26 SWG) (24 SWG) (22 SWG) (20 SWG) cross sectional area, CSA (m2) resistance, R () 1.6 107 2.6 107 4.0 107 6.5 107 3.1 2.0 1.3 0.8 Analysis – Part A Plot a graph resistance, R on the y-axis versus length, l on the x-axis. resistance v length 3.0 2.5 resistance () 2.0 1.5 1.0 0.5 0.0 0 0.25 0.5 0.75 1 1.25 length (m) 1. Give your graph a title. 2. Join your points with a line of best fit (trendline). 3. What does your graph indicate about the relationship between length and resistance for constant cross sectional area? The straight line is a good fit for the data points indicating that resistance is directly proportional to the length of the wire. This means that longer wires have higher resistance. Analysis – Part B Plot a graph resistance, R on the y-axis versus cross sectional area, CSA on the x-axis. resistance v cross sectional area 3.5 3.0 resistance () 2.5 2.0 1.5 1.0 y = 9E-07x-0.964 0.5 0.0 0.0E+00 1.0E-07 2.0E-07 3.0E-07 4.0E-07 5.0E-07 6.0E-07 7.0E-07 cross sectional area (m2) 4. Give your graph a title. 5. Join your points with a line of best fit (trendline). 6. What does your graph indicate about the relationship between length and resistance for constant cross sectional area? The graph forms a hyperbola. The equation of the line of best fit has a power of 0.964 which is approximately 1, indicating an inverse relationship between resistance and cross sectional area. This means that thicker wires have lower resistance. (Students may not necessarily quantify the power relationship) Georg Ohm discovered that the resistance of a material is directly proportional to its length and inversely proportional to its cross-sectional area. This means that longer wires should have more resistance and shorter wires have less resistance. Also, thicker wires have less resistance and thinner wires have more resistance. 7. Is this what you found from your graphs? Yes, both graphs confirm these two relationships. Resistivity The resistance of a given piece of material can be said to be: resistance = resistivity length cross sectional area 𝑅= 𝜌𝑙 𝐴 Resistivity has the symbol ‘’ which looks like a ‘p’ but is actually the Greek letter rho which has the modern sound of an ‘r’. Rearranging the formula to make the subject gives: 𝜌= 𝑅𝐴 𝑙 Resistivity is measured in ohm metres ( m). For nichrome wire it has the value of 100 108 m. For copper which is a very good conductor it has a value of 1.7 108 m. 8. Do you think nichrome is as good a conductor as copper? Why or why not? Better conductors have lower resistivity values. Since nichrome’s value is much higher than copper it is not nearly as good a conductor as copper. (However it is not an insulator, for example the resistivity of rubber is between 1 and 100 1013 ‼ Compared to copper this is approximately 1021 times as high‼) 9. Why do you think thicker wires have less resistance? (Think about how easy or hard it is for electrons to find a way through the material) Thicker wires have a wider and larger path for the electrons to flow through and this is much easier than for thinner wires which tend to constrict or narrow the electron path and hence resist it more. 10. Why do you think longer wires have more resistance? Every length of wire will resist electrons to a certain degree, so the longer the wire, the more time the electrons spend inside the wire and the more they are resisted.
