ion_current - University of Kentucky
advertisement
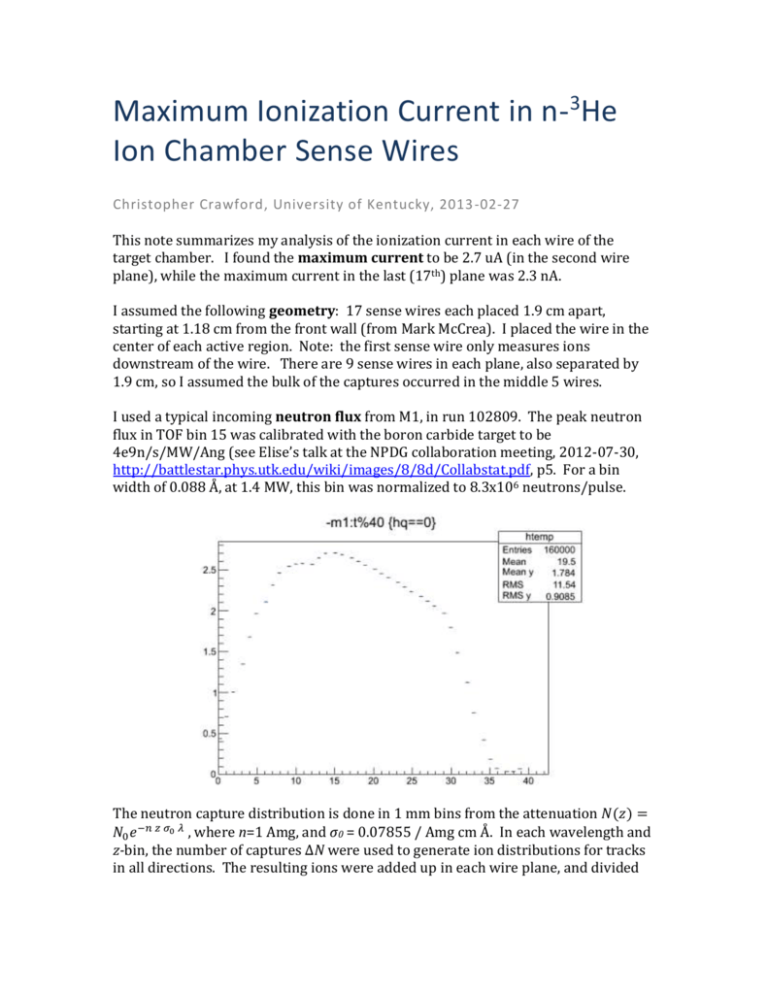
Maximum Ionization Current in n-3He Ion Chamber Sense Wires Christopher Crawford, University of Kentucky, 2013 -02-27 This note summarizes my analysis of the ionization current in each wire of the target chamber. I found the maximum current to be 2.7 uA (in the second wire plane), while the maximum current in the last (17th) plane was 2.3 nA. I assumed the following geometry: 17 sense wires each placed 1.9 cm apart, starting at 1.18 cm from the front wall (from Mark McCrea). I placed the wire in the center of each active region. Note: the first sense wire only measures ions downstream of the wire. There are 9 sense wires in each plane, also separated by 1.9 cm, so I assumed the bulk of the captures occurred in the middle 5 wires. I used a typical incoming neutron flux from M1, in run 102809. The peak neutron flux in TOF bin 15 was calibrated with the boron carbide target to be 4e9n/s/MW/Ang (see Elise’s talk at the NPDG collaboration meeting, 2012-07-30, http://battlestar.phys.utk.edu/wiki/images/8/8d/Collabstat.pdf, p5. For a bin width of 0.088 Å, at 1.4 MW, this bin was normalized to 8.3x10⁶ neutrons/pulse. The neutron capture distribution is done in 1 mm bins from the attenuation 𝑁(𝑧) = 𝑁0 𝑒 −𝑛 𝑧 𝜎0 𝜆 , where n=1 Amg, and σ0 = 0.07855 / Amg cm Å. In each wavelength and z-bin, the number of captures ΔN were used to generate ion distributions for tracks in all directions. The resulting ions were added up in each wire plane, and divided by the 5 middle wires in each plane to get the ionization. This was converted to μA by dividing by the TOF width of the bin, 0.4 ms. The ionization distribution was obtained from NIST tables, and was binned into 10 bins for the triton (left), and 25 for the proton (right), as in the following plot: The distance is in cm, and counts are ion pairs. There are 18109 total ion pairs in the distribution, or 760 keV / 40 eV per ion pair. The above plot shows the distribution along the direction of the back-to-back proton and triton. This distribution was averaged over all directions and projected on the z-axis (along the beam) to get the following forward distribution: The blue curve is the distribution of protons, the red is for tritons, and the sum is black. There is an identical distribution in the backward direction, so the total ions in this distribution are half of the previous plot. This distribution was convoluted with the distribution of captures discussed above. It was done separately for each TOF bin to generate the ion current in each wire as a function of TOF and wire plane #, as graphed below. Note that the maximum current would be 2.2 μA if the order of HV and sense wires were reversed so that there were only 16 sense wire planes. The ratio between front and back wire planes is 1173:1. These plots were generated with the script http://www.pa.uky.edu/%7Ecrawford/pub/ion_n3he.C

