WNC Quick Facts - Western Nevada College
advertisement
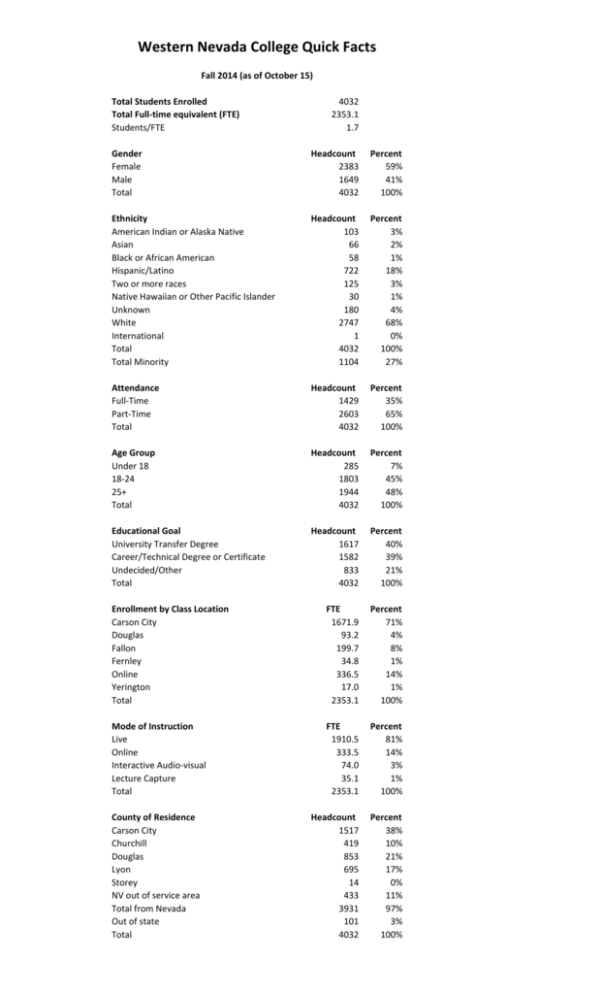
Western Nevada College Quick Facts Fall 2014 (as of October 15) Total Students Enrolled Total Full-time equivalent (FTE) Students/FTE 4032 2353.1 1.7 Gender Female Male Total Headcount 2383 1649 4032 Percent 59% 41% 100% Ethnicity American Indian or Alaska Native Asian Black or African American Hispanic/Latino Two or more races Native Hawaiian or Other Pacific Islander Unknown White International Total Total Minority Headcount 103 66 58 722 125 30 180 2747 1 4032 1104 Percent 3% 2% 1% 18% 3% 1% 4% 68% 0% 100% 27% Attendance Full-Time Part-Time Total Headcount 1429 2603 4032 Percent 35% 65% 100% Age Group Under 18 18-24 25+ Total Headcount 285 1803 1944 4032 Percent 7% 45% 48% 100% Educational Goal University Transfer Degree Career/Technical Degree or Certificate Undecided/Other Total Headcount 1617 1582 833 4032 Percent 40% 39% 21% 100% Enrollment by Class Location Carson City Douglas Fallon Fernley Online Yerington Total FTE 1671.9 93.2 199.7 34.8 336.5 17.0 2353.1 Percent 71% 4% 8% 1% 14% 1% 100% Mode of Instruction Live Online Interactive Audio-visual Lecture Capture Total FTE 1910.5 333.5 74.0 35.1 2353.1 Percent 81% 14% 3% 1% 100% Headcount 1517 419 853 695 14 433 3931 101 4032 Percent 38% 10% 21% 17% 0% 11% 97% 3% 100% County of Residence Carson City Churchill Douglas Lyon Storey NV out of service area Total from Nevada Out of state Total
