Chinook Salmon on the Klamath River
advertisement
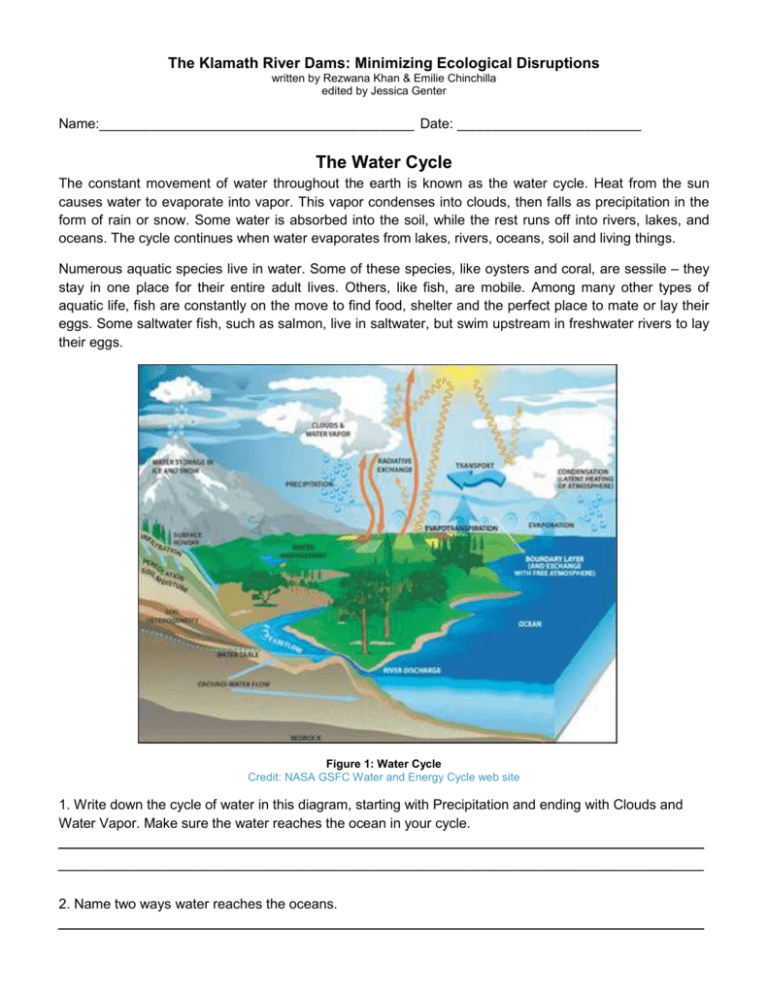
The Klamath River Dams: Minimizing Ecological Disruptions written by Rezwana Khan & Emilie Chinchilla edited by Jessica Genter Name:_________________________________________ Date: ________________________ The Water Cycle The constant movement of water throughout the earth is known as the water cycle. Heat from the sun causes water to evaporate into vapor. This vapor condenses into clouds, then falls as precipitation in the form of rain or snow. Some water is absorbed into the soil, while the rest runs off into rivers, lakes, and oceans. The cycle continues when water evaporates from lakes, rivers, oceans, soil and living things. Numerous aquatic species live in water. Some of these species, like oysters and coral, are sessile – they stay in one place for their entire adult lives. Others, like fish, are mobile. Among many other types of aquatic life, fish are constantly on the move to find food, shelter and the perfect place to mate or lay their eggs. Some saltwater fish, such as salmon, live in saltwater, but swim upstream in freshwater rivers to lay their eggs. Figure 1: Water Cycle Credit: NASA GSFC Water and Energy Cycle web site 1. Write down the cycle of water in this diagram, starting with Precipitation and ending with Clouds and Water Vapor. Make sure the water reaches the ocean in your cycle. ____________________________________________________________________________________ ____________________________________________________________________________________ 2. Name two ways water reaches the oceans. ____________________________________________________________________________________ Hydroelectric Dams Our world is dependent upon electricity, and many scientists are trying to find ways to increase the use of renewable energy, so that we can decrease the use of fossil fuels. One renewable energy source on which Americans rely is hydroelectric power, the use of moving water to create energy. A hydroelectric power plant uses a dam to store river water in a reservoir. When water is released from the reservoir, it flows through turbines, which spin powering generators to produce electricity. This electricity is then sent to transfer substations to be delivered to users and power the electric appliances like refrigerators, computers, and cell phones that people use everyday. These dams are an excellent first step to decreasing reliance on non-renewable fossil fuels for energy. The stored water is a renewable energy source for years to come. Unfortunately, hydroelectric dams affect local flora and fauna. For instance, dams impede fish that live in these rivers from migrating because the dams block the flow of water in rivers. Figure 2: Hydroelectric Dams Case Study: The Klamath River Hydroelectric power is produced from dams on the Klamath River. The Klamath River originates in the Upper Klamath Lake in South Central Oregon and meets the Pacific Ocean after flowing 263 miles through Northern California and Oregon. The Klamath Basin covers an area of 15,751 mi2 and discharges 17,010 ft³/s of water annually. Dams, built to provide people with electricity hinder the free flow of this huge water source. Daily Life in the Klamath River Basin The Klamath River Basin supports the livelihoods and communities that surround it in three ways: Figure 3: Map of The Klamath River 1. Dams are used to trap water to generate electricity for daily life needs like air conditioning and refrigeration. "Klamath map" by Background layer attributed to DEMIS Mapserver, map created by Shannon1 - Background 2. The dammed water is also used by farmers to and river course data from irrigate crops like potatoes, onions, strawberries, and http://www2.demis.nl/mapserver/mapper.asp grains. 3. Unlike the farmers, who take water from the River to grow food, fishermen require the water to stay in the Klamath River to support healthy fish populations. Below is a graph of the dams on Klamath River. Use this graph to answer the following questions. Production in Megawatts Dams and Power Generation 100 90 80 70 60 50 40 30 20 10 0 Keno Dam JC Boyle Dam Copco 1 Dam Copco 2 Dam Iron Gate Dam Fall Creek Dam Figure 4: Dams and Power Generation from The Klamath River 1. How many major dams are there on the Klamath River? _________________________________ 2. According to the graph above, how many dams generate electricity? _______________________ 3. Which dam produces the most electricity? How much does it produce? ______________________________________________________________________________ 4. Which dam produces the least electricity? ____________________________________________ 5. How much electricity does the Copco 2 Dam generate? _________________________________ 6. How much electricity would be generated if the Copco 1, Copco 2, Iron Gate and JC Boyle dams were removed? _________________________________________________________________ Chinook Salmon on the Klamath River Chinook salmon (Oncorhynchus tshawytscha) live in open ocean for most of their lifecycle. They return once to the rivers of their birth in either the fall or the spring to mate and lay eggs. Once they hatch, the salmon fry stay in freshwater up to 18 months before migrating to the ocean. As adults, they complete the migration loop, swimming from the ocean back to the freshwater stream of their birth to mate and lay eggs. Fig. 5: Male Chinook about to deposit sperm "Oncorhynchus tschawytscha" by USGS Ecological Disruption In general, dams disrupt the natural water cycle because they release water according to the needs of the human population alone. Water flow and water levels change based upon the rhythms of human daily needs rather than as result of the natural cycle of the system. The Mystery of the Dead Fish: Environmental Decline of Chinook Area From September 19th to October 1st of 2002, at least 34,000 fish died in the Lower Klamath River. Most were Chinook salmon. Figure 5: Dead Fishes Credit: Yurok Tribe The immediate cause of the salmon deaths was two pathogens - ich and columnaris. These pathogens made breathing difficult for the salmon, leading to a wide-scale die-off. Scientists wondered why the pathogen infestation was so severe, since normally these pathogens do not infect salmon on such a large scale. Since the pathogens don’t normally harm so many fish, government scientists decided to investigate the factors that might have made the river more hospitable to the pathogens. Scientists hypothesized that the lack of dissolved oxygen had something to do with the die-off, since fish need a certain amount of dissolved oxygen in the water in order to breathe. At first, scientists thought that high water temperature might be to blame for low dissolved oxygen. Here is why: 1) What happens to dissolved oxygen as water temperature increases? ____________________________________ ____________________________________ 2) Why might less oxygen in the water be a problem for oxygen breathing fish? ____________________________________ ____________________________________ ____________________________________ Figure 6– Relationship between Water Temperature and Dissolved Oxygen Scientists decided to look at the maximum daily water temperatures for the five years preceding the fish die-off. They looked at data from August to September to see if there was any correlation between high water temperature and the fish die-off. Figure 7: Daily maximum water temperatures Credit: Yoruk Tribe 1) On September 26th, how does water temperature in 2002 compare to the previous years? ______________________________________________________________________________ 2) For which date was the highest water temperature recorded? What was the recording? ______________________________________________________________________________ 3) In what year did the fish die-off occur? ______________________________________________________________________________ 4) If the highest water temperature was recorded in a year in which there was no fish die-off, what does that tell you about the correlation between water temperature and fish die-off? ______________________________________________________________________________ ______________________________________________________________________________ ______________________________________________________________________________ ______________________________________________________________________________ Since the data show that water temperature on its own is not a significant factor in the die-off, scientists began searching for other factors that may have contributed to the die off. There had been a drought from 2000 to 2001, so they began to examine the volume of water flow. Water flow is important, because fast moving turbulent water greatly increases the amount of dissolved oxygen in the water. Highly turbulent water allows oxygen-rich surface water to mix with oxygen-starved water below the surface. High water flow leads to turbulent water that increases oxygen richness throughout the entire volume of water. Low water levels lead to slowly moving water that tends to be oxygen poor below the surface. 1) From this passage, why might scientists think that water flow is a factor in the fish die-off? __________________________________________________________________________ __________________________________________________________________________ Scientists compared the water flow for the month of September over a few-year period. Here is what they found: Figure 8: September Water Flow 1988-2002 2) What is different about the 2002 line in relation to all the other yearly lines? __________________________________________________________________________ 3) Looking at these data, why might scientists think that water flow is a factor in the fish-die off? __________________________________________________________________________ 4) Even though the water temperature was relatively normal for this time period, do you think it was still a factor in the die-off? Would this same catastrophe have happened in the spring, before the onset of summer heat, when water temperatures are colder? __________________________________________________________________________ __________________________________________________________________________ In order to fully understand the ramifications of low water flow in 2002, scientists also needed to analyze fish density in the Klamath River during this time. Fish density would help scientists understand if there were too many fish in the water for the volume of river water. High fish density might be a significant factor because it could help the deadly pathogens described earlier (ich and columnaris) proliferate and move quickly from one salmon to another. Based on this information answer the questions below: 1) Among the conditions listed below, put a check in the appropriate column indicating your hypothesis about each condition. Condition Lots of Water and Lots of Fish Lots of Water and Few Fish Less Water and Lots of Fish Less Water and Few Fish Problem No Problem 2) What combination of circumstances do you hypothesize will be a problem? __________________________________________________________________________ Number of Salmon In order to test their hypothesis about the role of fish numbers in the fish die off, the scientists examined fish numbers in the river over a twenty plus year perioid. Below is the graph showing the yearly adult run size (the number of fish that migrate from the freshwater river to the saltwater ocean). Year Figure 9: Adult Fall Chinook Run Size 1) Was the run size of the Chinook salmon during the 2002 fish-die off below-average, average, or above-average? __________________________________________________________________________ 2) How many Chinook salmon were in the Klamath River in 2002? __________________________________________________________________________ 3) Why would an above-average run size be dangerous for fish in a year with below-average water flow? __________________________________________________________________________ __________________________________________________________________________ 4) Do the water flow and Chinook run size data above support your fish die-off hypothesis? If so, what claim can you make about the factors that caused the fish die-off? __________________________________________________________________________ __________________________________________________________________________ __________________________________________________________________________ 5) How can people insure higher water volume (increased water flow) in the river to protect the fish? (Review the Klamath River in Daily Life Section for ideas.) __________________________________________________________________________ __________________________________________________________________________ __________________________________________________________________________ Sustainability In response to the salmon decline, the Klamath Hydroelectric Settlement Agreement (KHSA) was signed by more than 40 organizations in 2010. The agreement devised a plan to remove 4 dams by 2020. Local stakeholders believe that dismantling the dams is the best possible option for protecting the salmon. Removal of the dams is expected to increase the size of the salmon population bringing them back from their precarious position in the ecosystem. However, if the dams are removed, then a new energy source must be found to substitute the 157MW of electricity produced by the dismantled dams. The following table shows the costs of different energy sources to generate 157MW of electricity: Energy Source PacifiCorp Hydropower COST (IN MILLIONS) $23.3 Natural Gas $27.7 Cogeneration $31 Wind $26.7 Coal $21.6 1) What is the cheapest option to replace hydropower? ____________________________________ The table below shows the amount of carbon dioxide emissions produced by each type of energy source: Natural Gas CO2 emissions (lbs/MWh) 1,135 Coal 2,249 Oil 1,672 Hydropower 0 Energy Source 2) What energy source has the highest CO2 emissions? ____________________________________ 3) Why is coal NOT the best option to replace the energy lost from the four dismantled dams? _________________________________________________________________________________ _________________________________________________________________________________ To reduce greenhouse emissions, alternative energy sources must be considered. Examine the pie chart below to determine energy options for the Klamath region. Figure 10: Mix of energy sources used in the Klamath River region 1) What type of resource supplies the most energy to the region? ___________________________ 2) What percentage of the region’s energy is renewable? ___________________________________ 3) Which renewable is the most common? What is the problem with this renewable energy? _________________________________________________________________________________ 4) Which other renewable energy sources are possible options? _________________________________________________________________________________ 5) Which renewable sources of energy are not listed? _________________________________________________________________________________ 6) Which option do you think is the most sustainable option and which one do you think is the least sustainable? Why? _________________________________________________________________________________ _________________________________________________________________________________ Conclusion Now that you know that global natural resources for energy production are scarce and renewable energy also causes ecological disruption, what steps would you take at an individual level to reduce pressure on energy demand? ____________________________________________________________________________________ ____________________________________________________________________________________ ____________________________________________________________________________________ ____________________________________________________________________________________ ____________________________________________________________________________________
