Assignment #1 For both the experiments below, show all your work
advertisement
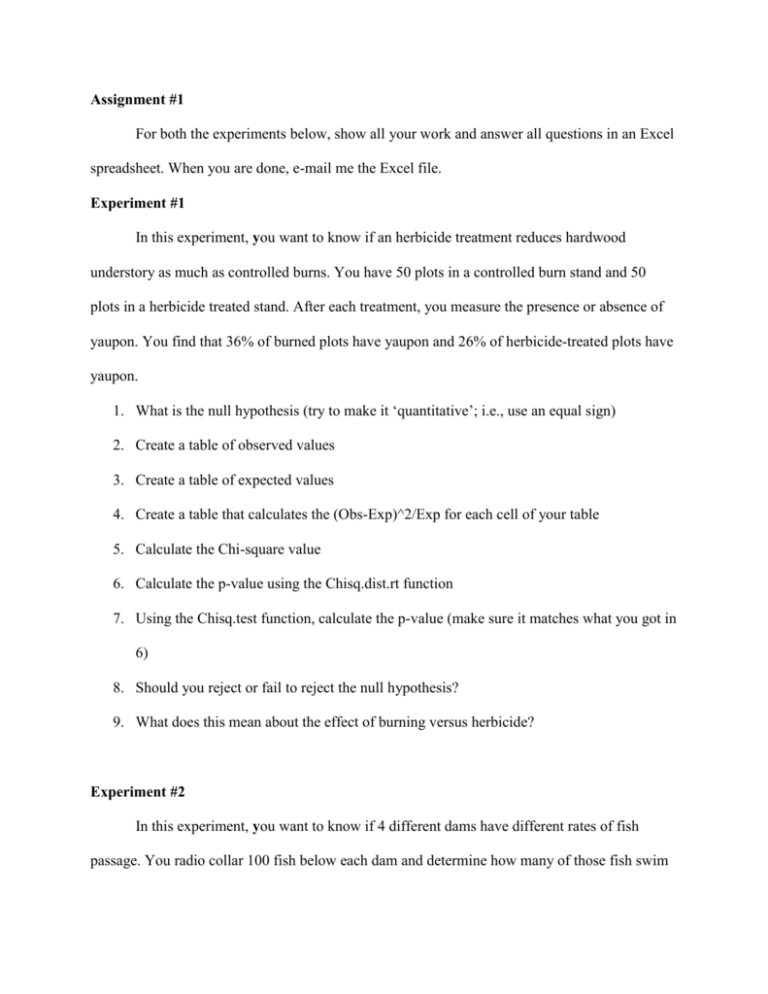
Assignment #1 For both the experiments below, show all your work and answer all questions in an Excel spreadsheet. When you are done, e-mail me the Excel file. Experiment #1 In this experiment, you want to know if an herbicide treatment reduces hardwood understory as much as controlled burns. You have 50 plots in a controlled burn stand and 50 plots in a herbicide treated stand. After each treatment, you measure the presence or absence of yaupon. You find that 36% of burned plots have yaupon and 26% of herbicide-treated plots have yaupon. 1. What is the null hypothesis (try to make it ‘quantitative’; i.e., use an equal sign) 2. Create a table of observed values 3. Create a table of expected values 4. Create a table that calculates the (Obs-Exp)^2/Exp for each cell of your table 5. Calculate the Chi-square value 6. Calculate the p-value using the Chisq.dist.rt function 7. Using the Chisq.test function, calculate the p-value (make sure it matches what you got in 6) 8. Should you reject or fail to reject the null hypothesis? 9. What does this mean about the effect of burning versus herbicide? Experiment #2 In this experiment, you want to know if 4 different dams have different rates of fish passage. You radio collar 100 fish below each dam and determine how many of those fish swim upstream through the dam (locks, fish ladders, etc.) over the course of 10 weeks. You find that 36% of fish passed through dam 1, 38% of fish passed through dam 2, 65% of fish passed through dam 3, and 14% of fish passed through dam 4. 1. What is the null hypothesis (try to make it ‘quantitative’; i.e., use an equal sign) 2. Create a table of observed values 3. Create a table of expected values 4. Create a table that calculates the (Obs-Exp)^2/Exp for each cell of your table 5. Calculate the Chi-square value 6. Calculate the p-value using the Chisq.dist.rt function 7. Using the Chisq.test function, calculate the p-value (make sure it matches what you got in 6) 8. Should you reject or fail to reject the null hypothesis? 9. What does this mean about the differences in fish passage rates at the four dams? Bonus As I discussed in class, Experiment 2 indicates whether there is any differences between ANY of the dams. Conduct analyses to see if dams 2 and 3 had significantly different passage rates. Also, conduct analyses to see if dams 1 and 2 had significantly different passage rates.
