non-negotiable!
advertisement
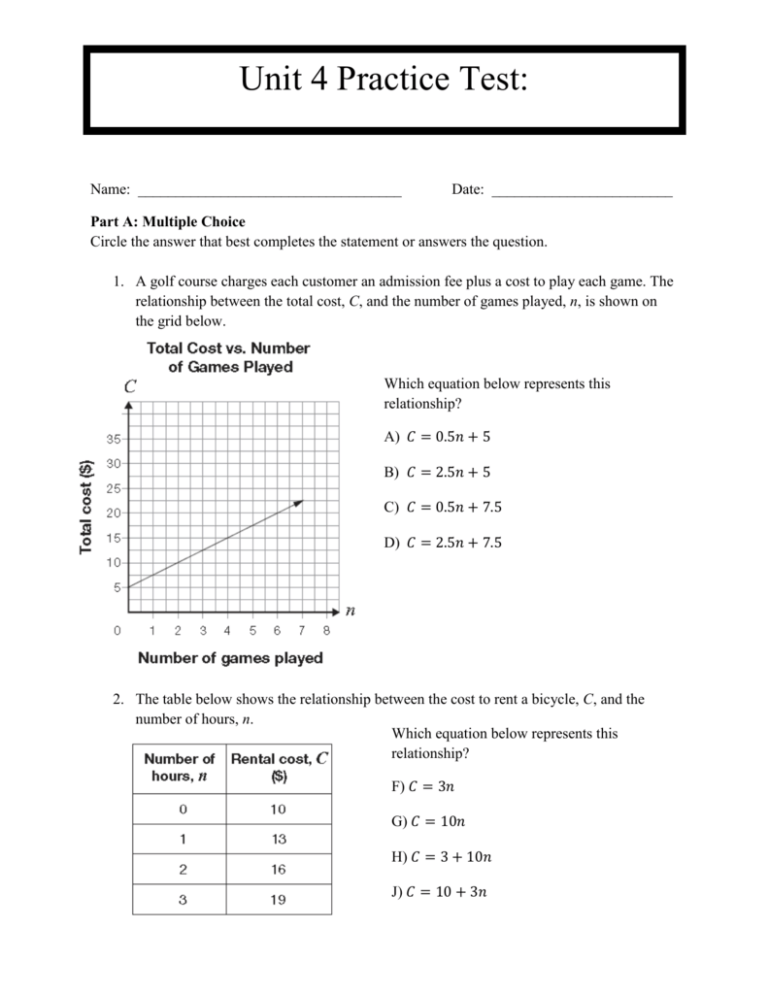
Unit 4 Practice Test: Name: ___________________________________ Date: ________________________ Part A: Multiple Choice Circle the answer that best completes the statement or answers the question. 1. A golf course charges each customer an admission fee plus a cost to play each game. The relationship between the total cost, C, and the number of games played, n, is shown on the grid below. Which equation below represents this relationship? A) 𝐶 = 0.5𝑛 + 5 B) 𝐶 = 2.5𝑛 + 5 C) 𝐶 = 0.5𝑛 + 7.5 D) 𝐶 = 2.5𝑛 + 7.5 2. The table below shows the relationship between the cost to rent a bicycle, C, and the number of hours, n. Which equation below represents this relationship? F) 𝐶 = 3𝑛 G) 𝐶 = 10𝑛 H) 𝐶 = 3 + 10𝑛 J) 𝐶 = 10 + 3𝑛 Part B: Short Answer Show all your work and use the marks as a guide. Use full sentences where required. Mathematical terminology must be spelt correctly in order to earn full marks. 1. Graph a linear relation with an initial value of 4 on the grid below. 2. Beau has to take a taxi to school because he missed his bus. There is a sign in the taxi that describes the total cost for a ride: BRIGGS TAXI We don’t take your complaints seriously! Taxi Rate: $3.25 base fee plus $0.20 per km. NON-NEGOTIABLE! a) What is the constant rate of change for this relation? What does it mean for this situation? b) What is the initial value for this relation? What does it mean for this situation? c) Write the equation that represents this linear relation. Be sure to define your variables with ‘Let’ statements! 3. Determine whether the table of values below represents a linear or non-linear relation. Explain your answer. [6 marks] x y 10 -4 x y 6 0 4 1 2 3 8 -1 Differences Conclusion: A 4. a) Which of the following two lines is steeper ? B b) Determine the rate of change of line A. Show your work. 5. The equation C = 10 + 2n represents the total cost, in dollars, of going on n rides at a local carousel. a) Complete the table of values for this situation. b) Graph the linear relation on the grid below. 6. For question 5 (above), a. Does it represent a direct variation or a partial variation? Explain. b. If the equation was changed to C = 5 + 3n, how would this affect the graph? Part C: Open Question 1. Create a table of values that would represent a linear relation. x y 2. Explain why your table of values represents a linear relation. 3. What is the constant rate of change for your table of values? Show your work. 4. Identify the initial value in your table of values. Explain how you knew that. 5. Write an equation for your linear relation. 6. Is your linear relation a direct variation or a partial variation? Explain. Part D: Thinking Question You are allowed to use your calculator for this question. However, write down the numbers you use and the operations you carry out. Try to give a clear, well-organized solution to illustrate your complete understanding and ability to communicate. Give as much information as you can. Mr. Briggs needs to rent a car to go on a trip. The total cost of renting a car includes a fixed fee and a cost per kilometer the vehicle is driven. Information about the total cost of two different rental companies is shown below. Enterprise Rent-A-Car Discount Car Rental Kilometers Total Driven, k cost, C ($) 100 200 300 115 140 165 Which rental company’s total cost has a lower cost per kilometer driven? Circle one: Enterprise Justify your answer. Discount
