Review Worksheet On Topo Maps
advertisement
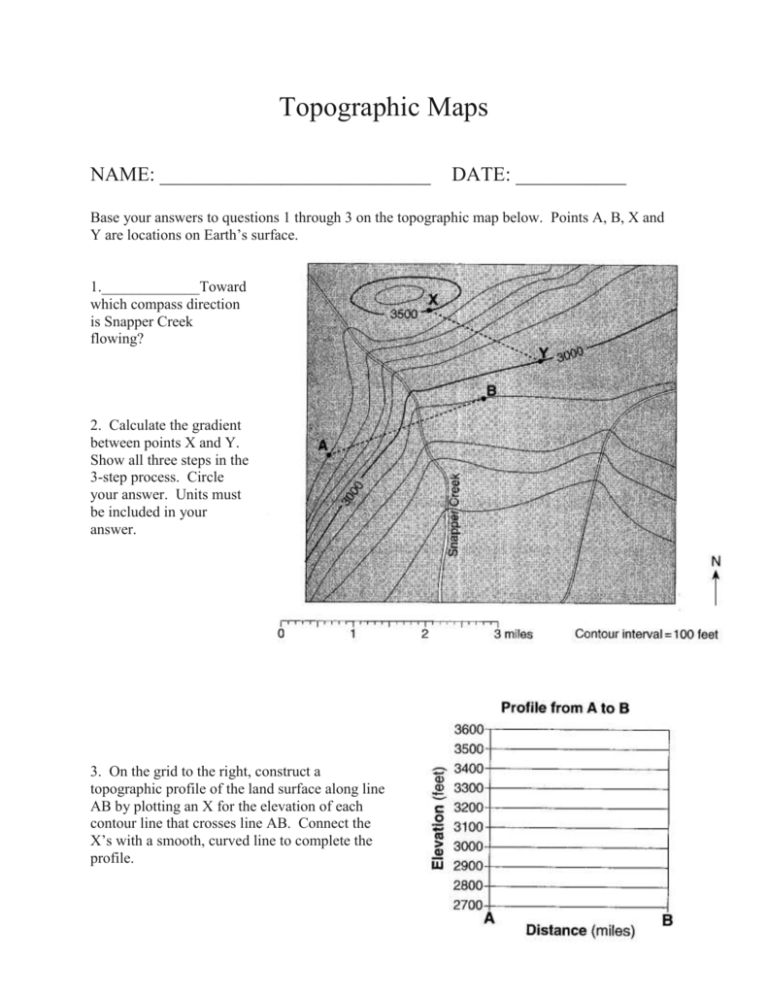
Topographic Maps NAME: ___________________________ DATE: ___________ Base your answers to questions 1 through 3 on the topographic map below. Points A, B, X and Y are locations on Earth’s surface. 1._____________Toward which compass direction is Snapper Creek flowing? 2. Calculate the gradient between points X and Y. Show all three steps in the 3-step process. Circle your answer. Units must be included in your answer. 3. On the grid to the right, construct a topographic profile of the land surface along line AB by plotting an X for the elevation of each contour line that crosses line AB. Connect the X’s with a smooth, curved line to complete the profile. Base your answers to questions 4 through 7 on the topographic map below, which shows a small island in an ocean. Points A, B, C and D represent surface locations on the island. The triangle symbol represents an elevation on the hilltop. Elevations are measured in feet and distances are measured in miles. 4. State the compass direction toward which Mud Creek flows. 5. Calculate the gradient of Mud creek between points C and D and label your answer with the correct units. Show all steps of the 3-step process and circle your answer. 6. On the grid to the right, construct a profile along line AB by plotting an X for the elevation of each contour line that crosses line AB. Connect the X’s with a smooth, curved line to complete the profile. 7. Explain how the contour lines on the map indicate that the north side of the island has the steepest slope. Base your answers to questions 8 through 10 on the topographic map below. Points A and B are reference points on the map. The triangle symbols show the highest elevations on Eagle Hill and Timothy Hill. Elevations are shown in feet. 8. Identify the general compass direction toward which Auroro Creek is flowing. 9. State a possible elevation of the top of Patriot Hill. 10. On the grid below, construct a topographic profile along line AB by plotting an X for the elevation of each contour line that crosses line AB. Connect the plotted X’s with a smooth, curved line to complete the profile. Points A and B have been plotted. The topographic map to the right shows a stream. 11._________In which general direction is the stream flowing? (1) northeast (2) northwest (3) southeast (4) southwest The topographic map to the right shows locations X and Y. 12.__________What is the approximate gradient between X and Y? (1) 15 ft/mi (2) 20 ft/mi (3) 30 ft/mi (4) 60 ft/mi Base your answers to questions 13 and 14 on the isoline map to the right, which shows the average yearly precipitation, in inches, across New York State. 13._________Which New York State landscape region receives the greatest average yearly precipitation? (1) Catskills (3) Adirondack Mountains (2) Tug Hill Plateau (4) Taconic Mountains 14._________Approximately how many inches of average yearly precipitation does Rochester, New York receive? (1) 26 (2) 30 (3) 38 (4) 42 Base your answers to questions 15 through 18 on the topographic map shown below. Letters A, B, C, d and E represent locations on Earth’s surface. Letters K, L, M and N are locations along Copper Creek. Elevations are measured in meters. 15._________What is the elevation of location A? 16.______________Calculate the gradient between points B and C and label your answer with the correct units. 17. On the grid to the right, construct a topographic profile along line DE by plotting an X for the elevation of each contour line that crosses line DE. Connect the X’s with a smooth, curved line to complete the profile. 18. Explain how the map indicates that Copper Creek flows faster between points N and M than between points L and K. Base your answers to questions 19 through 21 on the map to the right. The map shows the water depth, measured in feet, at the north end of one of the Finger Lakes. Points A and B are locations at the lake’s shoreline. Points X and Y are locations on the bottom of the lake. 19. On the map to the right, draw the 20-foot-depth isoline. The isoline must extend to the edge of the map. 20. On the grid to the right, construct a profile along the line from point A to point B. Plot the depth along line AB by marking an X at each numbered point where a water depth is shown. Complete the profile by connecting the Xs with a smooth, curved line. The Xs for point A and point B have been plotted. 21. Calculate the gradient between point X and point Y. Label your answer with the correct units. 22. Using the map to the right, determine the rate, in miles per year, that the front edge of the Taku glacier moved between point A and point B. 23. What is the contour interval on this map? 24. On the map to the right, draw the 4, 6 and 8 isolines. 25. Assume these values represent relative damage caused by an earthquake. Place an X where you infer the earthquake epicenter is located. Base your answers to questions 26 through 28 on the field map to the right. The map shows elevations, measured in feet, of a number of points in a certain geographic region. Contour lines have been drawn for the 100-foot and 120-foot elevations. Points A and B represent two spot elevations on the map. 26. On the map to the right, draw the 60-foot contour line. make sure that the contour line extends to the edges of the map. 27. Toward which general compass direction does Elma Creek flow? 28. Calculate the gradient between points A and B. Label the answer with the correct units.

