eTABLE 1. Incidence densities and attributable outcomes for
advertisement
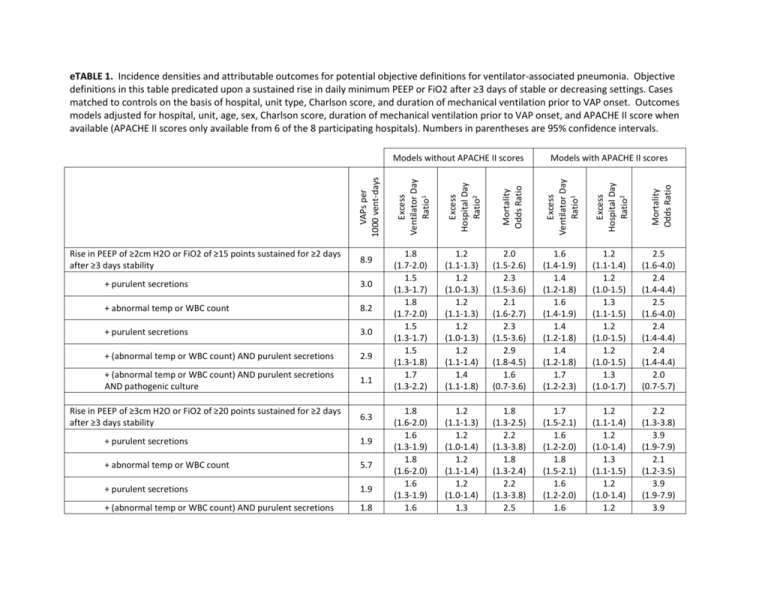
eTABLE 1. Incidence densities and attributable outcomes for potential objective definitions for ventilator-associated pneumonia. Objective definitions in this table predicated upon a sustained rise in daily minimum PEEP or FiO2 after ≥3 days of stable or decreasing settings. Cases matched to controls on the basis of hospital, unit type, Charlson score, and duration of mechanical ventilation prior to VAP onset. Outcomes models adjusted for hospital, unit, age, sex, Charlson score, duration of mechanical ventilation prior to VAP onset, and APACHE II score when available (APACHE II scores only available from 6 of the 8 participating hospitals). Numbers in parentheses are 95% confidence intervals. Rise in PEEP of ≥2cm H2O or FiO2 of ≥15 points sustained for ≥2 days after ≥3 days stability 8.9 + purulent secretions 3.0 + abnormal temp or WBC count 8.2 + purulent secretions 3.0 + (abnormal temp or WBC count) AND purulent secretions 2.9 + (abnormal temp or WBC count) AND purulent secretions AND pathogenic culture 1.1 Rise in PEEP of ≥3cm H2O or FiO2 of ≥20 points sustained for ≥2 days after ≥3 days stability 6.3 + purulent secretions 1.9 + abnormal temp or WBC count 5.7 + purulent secretions 1.9 + (abnormal temp or WBC count) AND purulent secretions 1.8 Mortality Odds Ratio Excess Hospital Day Ratio2 Models with APACHE II scores Excess Ventilator Day Ratio1 Mortality Odds Ratio Excess Hospital Day Ratio2 Excess Ventilator Day Ratio1 VAPs per 1000 vent-days Models without APACHE II scores 1.8 (1.7-2.0) 1.5 (1.3-1.7) 1.8 (1.7-2.0) 1.5 (1.3-1.7) 1.5 (1.3-1.8) 1.7 (1.3-2.2) 1.2 (1.1-1.3) 1.2 (1.0-1.3) 1.2 (1.1-1.3) 1.2 (1.0-1.3) 1.2 (1.1-1.4) 1.4 (1.1-1.8) 2.0 (1.5-2.6) 2.3 (1.5-3.6) 2.1 (1.6-2.7) 2.3 (1.5-3.6) 2.9 (1.8-4.5) 1.6 (0.7-3.6) 1.6 (1.4-1.9) 1.4 (1.2-1.8) 1.6 (1.4-1.9) 1.4 (1.2-1.8) 1.4 (1.2-1.8) 1.7 (1.2-2.3) 1.2 (1.1-1.4) 1.2 (1.0-1.5) 1.3 (1.1-1.5) 1.2 (1.0-1.5) 1.2 (1.0-1.5) 1.3 (1.0-1.7) 2.5 (1.6-4.0) 2.4 (1.4-4.4) 2.5 (1.6-4.0) 2.4 (1.4-4.4) 2.4 (1.4-4.4) 2.0 (0.7-5.7) 1.8 (1.6-2.0) 1.6 (1.3-1.9) 1.8 (1.6-2.0) 1.6 (1.3-1.9) 1.6 1.2 (1.1-1.3) 1.2 (1.0-1.4) 1.2 (1.1-1.4) 1.2 (1.0-1.4) 1.3 1.8 (1.3-2.5) 2.2 (1.3-3.8) 1.8 (1.3-2.4) 2.2 (1.3-3.8) 2.5 1.7 (1.5-2.1) 1.6 (1.2-2.0) 1.8 (1.5-2.1) 1.6 (1.2-2.0) 1.6 1.2 (1.1-1.4) 1.2 (1.0-1.4) 1.3 (1.1-1.5) 1.2 (1.0-1.4) 1.2 2.2 (1.3-3.8) 3.9 (1.9-7.9) 2.1 (1.2-3.5) 3.9 (1.9-7.9) 3.9 + (abnormal temp or WBC count) AND purulent secretions AND pathogenic culture Rise in PEEP of ≥5cm H2O or FiO2 of ≥20 points sustained for ≥2 days after ≥3 days stability 0.3 3.8 + purulent secretions 1.2 + abnormal temp or WBC count 3.5 + purulent secretions 1.2 + (abnormal temp or WBC count) AND purulent secretions 1.1 (1.4-2.0) 1.8 (1.1-3.0) (1.1-1.5) 2.0 (1.3-3.0) (1.4-4.4) 0.8 (0.1-5.7) (1.2-2.0) Cannot estimate3 (1.0-1.4) Cannot estimat3 (1.9-7.9) Cannot estimate3 1.7 (1.5-1.9) 1.8 (1.4-2.3) 1.6 (1.4-1.8) 1.8 (1.4-2.3) 1.9 (1.5-2.4) 1.8 (1.0-3.4) 1.2 (1.0-1.3) 1.3 (1.1-1.7) 1.2 (1.0-1.4) 1.3 (1.1-1.7) 1.4 (1.1-1.8) 1.9 (1.2-3.1) 1.6 (1.1-2.4) 2.6 (1.3-5.4) 1.8 (1.2-2.6) 2.6 (1.3-5.4) 3.6 (1.7-7.6) 1.7 (0.2-14) 1.7 (1.4-2.2) 2.0 (1.4-2.8) 1.7 (1.3-2.1) 2.0 (1.4-2.8) 2.0 (1.4-2.8) Cannot estimate3 1.3 (1.1-1.6) 1.4 (1.0-1.9) 1.3 (1.1-1.6) 1.4 (1.0-1.9) 1.4 (1.0-1.9) Cannot estimat3 2.7 (1.4-5.4) 6.1 (2.2-16.7) 2.6 (1.3-5.3) 6.1 (2.2-16.7) 6.1 (2.2-17) Cannot estimate3 + (abnormal temp or WBC count) AND purulent secretions 0.2 AND pathogenic culture 1 Ratio of ventilator days from VAP to extubation in cases versus matched controls 2 Ratio of hospital days from VAP to hospital discharge in cases versus matched controls 3 Too few events to reliably estimate attributable outcomes eTable 2. Covariates for regression models for intermediate respiratory deterioration (rise in daily minimum PEEP of ≥3cm H2O or FiO2 of ≥20 points sustained for ≥2 days after ≥2 days of stable or decreasing daily minimum PEEP and/or FiO2) Ventilator Days Rise in PEEP of ≥3cm H2O or FiO2 of ≥20 points sustained for ≥2 days Hospital Hospital A Hospital B Hospital C Hospital D Hospital E Hospital F Unit Medical Thoracic Cardiac Neurologic Surgical Sex Female Male Age 1 year increments Charlson score 1 point increments APACHE II score 1 point increments Hospital Days Hospital Death Odd Ratio (95% CI) P Odd Ratio (95% CI) P Odd Ratio (95% CI) P 1.9 (1.7-2.1) <.001 1.4 (1.2-1.5) <.001 2.4 (1.6-3.6) <.001 1.3 (1.0-1.7) 1.1 (0.4-3.3) 1.4 (1.1-1.8) 1.3 (0.9-1.9) 2.7 (1.7-4.5) reference .10 .87 .01 .18 <.001 -- 1.0 (0.8-1.3) 0.5 (0.2-1.3) 1.3 (1.1-1.6) 1.0 (0.8-1.3) 2.6 (1.8-3.7) reference .72 .17 <.01 .96 <.001 -- 1.2 (0.6-2.3) 3.9 (0.4-34.8) 1.4 (0.8-2.5) 0.9 (0.4-2.2) 5.2 (1.6-17.1) reference .57 .22 .25 .84 <.01 1.0 (0.8-1.3) 1.0 (0.8-1.3) 1.0 (0.7-1.3) 1.4 (1.0-1.9) reference .87 .80 .86 .03 -- 0.9 (0.7-1.0) 1.2 (1.0-1.4) 0.9 (0.7-1.1) 1.0 (0.8-1.3) reference .08 .10 .30 .95 -- 0.4 (0.2-0.8) 0.3 (0.1-0.6) 1.0 (0.5-1.9) 1.0 (0.5-2.2) reference .01 <.01 .36 .93 -- 1.08 (0.96-1.21) reference .20 -- 0.9 (0.9-1.0) reference .23 -- 1.1 (0.8-1.6) reference .53 -- 1.00 (0.99-1.00) .02 0.99 (0.99-1.0) <.001 1.02 (1.01-1.03) <.01 0.99 (0.95-1.03) .71 1.0 (0.98-1.04) .58 1.27 (1.16-1.40) <.001 1.00 (1.00-1.01) .21 1.00 (0.99-1.00) .94 1.01 (0.99-1.03) .38
