first - wikifortrial
advertisement
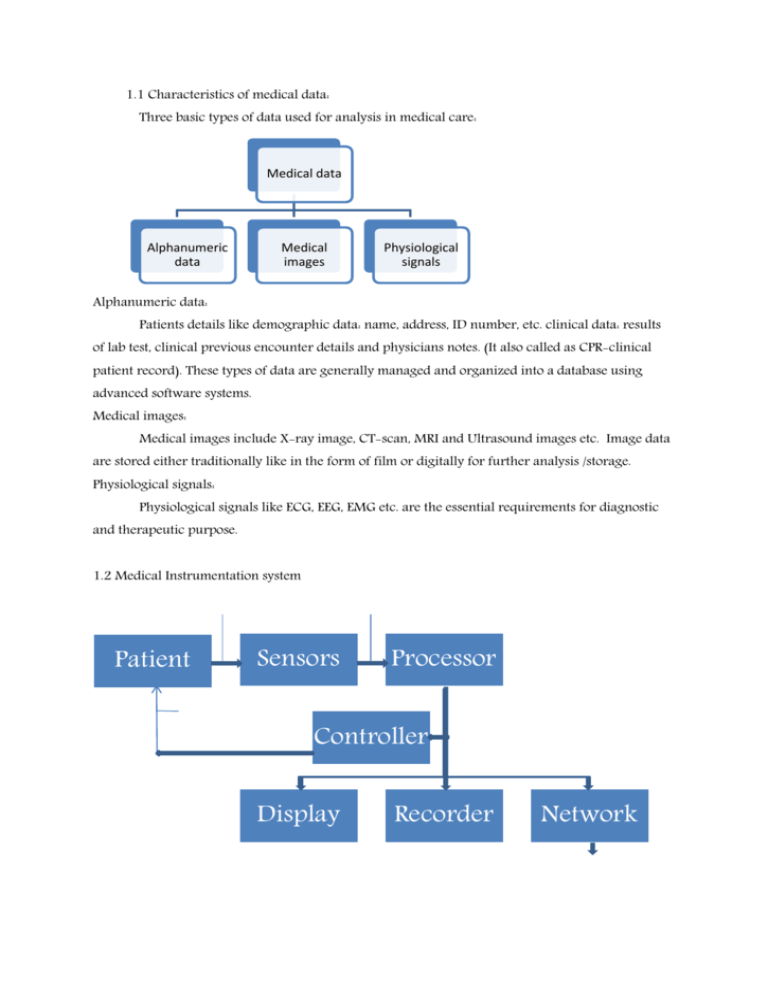
1.1 Characteristics of medical data: Three basic types of data used for analysis in medical care: Medical data Alphanumeric data Medical images Physiological signals Alphanumeric data: Patients details like demographic data: name, address, ID number, etc. clinical data: results of lab test, clinical previous encounter details and physicians notes. (It also called as CPR-clinical patient record). These types of data are generally managed and organized into a database using advanced software systems. Medical images: Medical images include X-ray image, CT-scan, MRI and Ultrasound images etc. Image data are stored either traditionally like in the form of film or digitally for further analysis /storage. Physiological signals: Physiological signals like ECG, EEG, EMG etc. are the essential requirements for diagnostic and therapeutic purpose. 1.2 Medical Instrumentation system Patient Sensors Processor Controller Display Recorder Network The above block diagram concentrates on the acquisition and analysis of physiological signals. Physiological signals are acquired form the patients Sensors / transducers converts physiological signals into its equivalent electrical signals Processors used to process the output form the sensor using signal conditioning operations like amplification, filtering etc. For further processing real time processors are used. Controller: processed signal is used for either for open loop (human intervention) or closed loop control function (automated intervention). Display unit: Usually CRT / analog meters are used for the display of processed data. Recorders: Graph, chart, magnetic tape, disc etc. are used for processed data storage Network: Transmission of processed data is achieved using communications modalities. The above block diagram can be used to describe the medical instrumentation systems like ICU, cardiac pacemaker etc. ICU constitutes several sensors, processors and patient monitoring systems. In case of cardiac pacemakers sensors are electrodes, the processor is usually a specialized integrated circuit, electrical stimulator as a closed loop controller. 1.3 Medical care system Collection of data Patient Analysis of data Therapy Decision making Data collection is the starting point in the health care-CPR Analysis of data is achieved using signal conditioning circuits and processors. Decision making: Analysed data are used for decision making through medical experts or intelligent systems. Proper decision making leads to correct diagnosis and appropriate therapy 1.5 Physiology of heart Heart is a four chambered pump with two atria for collection of blood and two ventricles for pumping the blood. The resting or filling phase of cardiac chamber is called diastole, the contracting or pumping phase is called systole. 1.5.1 The electrical system of the heart 1.4 Electrocardiogram The ECG is the electrical manifestation of the contractile activity of the heart and can be recorded using surface electrodes or chest electrodes. 1.5 Genesis of ECG: SA node: is the natural pacemaker, triggers its own train of action potentials. The action potential of the SA node propagates through the rest of the heart, causing a particular pattern of excitation and contraction. P-wave: Amplitude 0.1-0.2 mV and duration 60 to 80 milliseconds. Caused due to the slow moving depolarization that is contraction of the atria. PQ-segment: 60 to 80 milliseconds after P-wave. This delay is at the AV node. This delay assists in the completion of transfer of blood from the atria to the ventricles. The His bundle, the bundle branches, and Purkinge fibres propagate the stimulus to the ventricles at a very high rate. QRS-complex: Amplitude 1 mV and duration 80 milliseconds. A sharp biphase or triphase wave due to the stimulus that spreads rapidly from the apex of the heart upwards, causing rapid depolarization (contraction) of ventricles. ST-segments: 100 to 120 milliseconds, segment after QRS. Due to the ventricular muscle cells possess a relatively long action potential. T-wave: Amplitude 0.1 to 0.3 mV and duration 120 to 160 milliseconds. Due to repolarization (relaxation) of ventricles. Any disturbance in the regular rhythm of the heart is called arrhythmia. 1.6. Standard limb leads Three basic systems are used in cardiology. Figure. Enthoven’s triangle and the axes of the 6 ECG leads formed by using four limb leads Most widely used is 12 lead systems Lead I , II and III V1 to V6 chest lead AVL, AVR, AVF augmented leads A combined reference known as Wilson’s central terminal is used with the combination of chest lead. The 6th limb leads i.e. lead I, II, III with AVL, AVR, AVF is given a hypothetical equilateral triangle formed by the limb lead known as Enthoven’s triangle. The heart is assumed to be placed at the centre of the triangle i.e. at the Wilson’s center. Six leads measure the projections of 3D cardiac vector on to the axis as shown in the diagram. Figure of Enthoven’s triangle. Lead I, II, III is the potential difference of limbs as indicated. Applying KVL, II-I-III=0 II=I+III III=II-I I=II-III Most of the machines measures I and II to compute III 1.7 Augmented limb lead Figures 2.11, 2.22 etc. The figures show the scheme to produce large amplitude signals. In the case of left arm signals called AVL is measured using the average of the potentials on the other two limbs as a reference. From the bottom left loop iR+iR-II=0 iR=II/2 --------(1) from the bottom right loop -iR+III+AVL=0 AVL=iR-III ------(2) Combining equations 1 and 2 gives AVL=(II/2)-III =(II-2*III)/2 Substituting II=III+I AVL=(I-II)/2 Similarly AVR and AVF can be derived. AVR=(III-II)/2 AVF=(II+III)/2 These are the thevenin’s equivalent voltages for the AVR, AVL and AVF. Even though measurement of two leads is sufficient to get all the three lead measurements, the physician still needs the appearance of these three leads to facilitate the diagnosis. 1.8. ECG signal characteristics Between used for 12lead
