Debugging Tools
advertisement
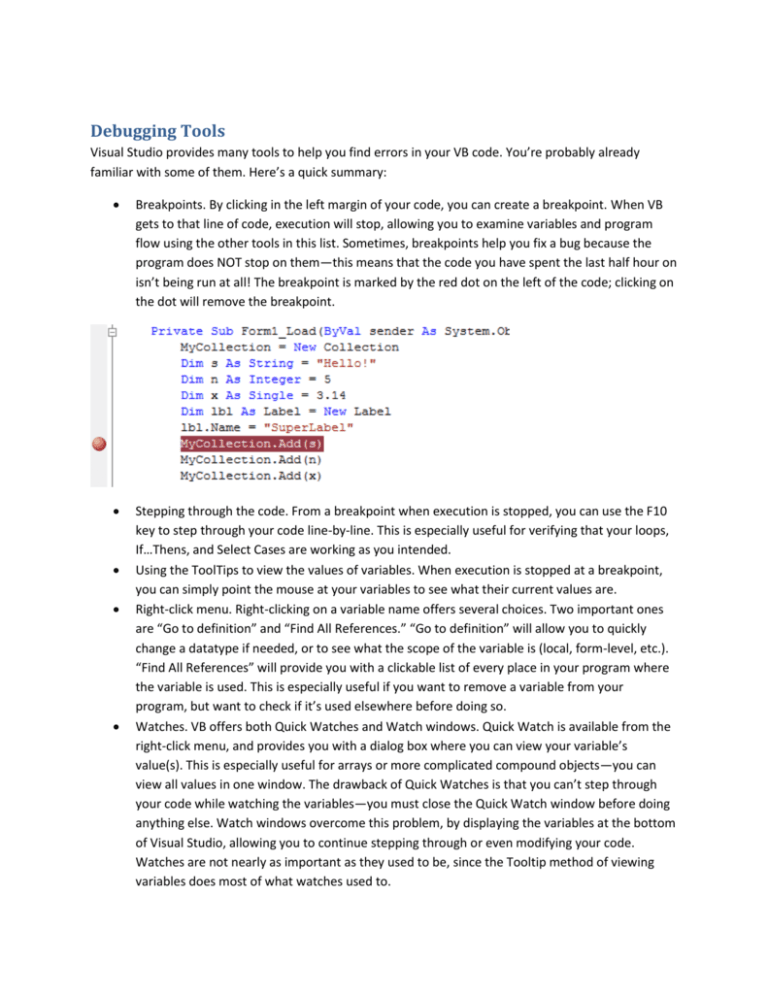
Debugging Tools Visual Studio provides many tools to help you find errors in your VB code. You’re probably already familiar with some of them. Here’s a quick summary: Breakpoints. By clicking in the left margin of your code, you can create a breakpoint. When VB gets to that line of code, execution will stop, allowing you to examine variables and program flow using the other tools in this list. Sometimes, breakpoints help you fix a bug because the program does NOT stop on them—this means that the code you have spent the last half hour on isn’t being run at all! The breakpoint is marked by the red dot on the left of the code; clicking on the dot will remove the breakpoint. Stepping through the code. From a breakpoint when execution is stopped, you can use the F10 key to step through your code line-by-line. This is especially useful for verifying that your loops, If…Thens, and Select Cases are working as you intended. Using the ToolTips to view the values of variables. When execution is stopped at a breakpoint, you can simply point the mouse at your variables to see what their current values are. Right-click menu. Right-clicking on a variable name offers several choices. Two important ones are “Go to definition” and “Find All References.” “Go to definition” will allow you to quickly change a datatype if needed, or to see what the scope of the variable is (local, form-level, etc.). “Find All References” will provide you with a clickable list of every place in your program where the variable is used. This is especially useful if you want to remove a variable from your program, but want to check if it’s used elsewhere before doing so. Watches. VB offers both Quick Watches and Watch windows. Quick Watch is available from the right-click menu, and provides you with a dialog box where you can view your variable’s value(s). This is especially useful for arrays or more complicated compound objects—you can view all values in one window. The drawback of Quick Watches is that you can’t step through your code while watching the variables—you must close the Quick Watch window before doing anything else. Watch windows overcome this problem, by displaying the variables at the bottom of Visual Studio, allowing you to continue stepping through or even modifying your code. Watches are not nearly as important as they used to be, since the Tooltip method of viewing variables does most of what watches used to. Immediate Window. This is one of the debugging windows available on the DebugWindows menu. It allows you to “try out” code without actually adding it to your procedure. While stopped at a breakpoint, type (or copy) the code you want to try. This can be useful when you have a big line of code that is giving the error, and you’re not sure which part of the code is the problem. You can examine it part-by-part in the immediate window. You can also do “what-if” trials by changing variable values right before a line runs. (Maybe this code doesn’t run because x is 5—what if x were 7? Type x = 7 in the immediate window and hit F10 to resume execution to see if that fixed the problem. If so, you can look at the code above to see how to make sure x isn’t 5 again.) Call Stack. Often when you get an error, execution will halt on a line of code that doesn’t seem to have anything wrong with it. The problem is that bad data was passed to that procedure from the procedure which called it. How do you find out which procedure called it? Use the Call Stack window (also available under the DebugWindows menu). It will display a list of the current procedure, followed by the procedure that called it, followed by the procedure that called it, etc. Double-clicking on one of these lines will take you directly to the code in the calling procedure which may have caused the problem. Open one of your programs and try out all of these methods to become familiar with them.


