spectrophotometry – instructions
advertisement
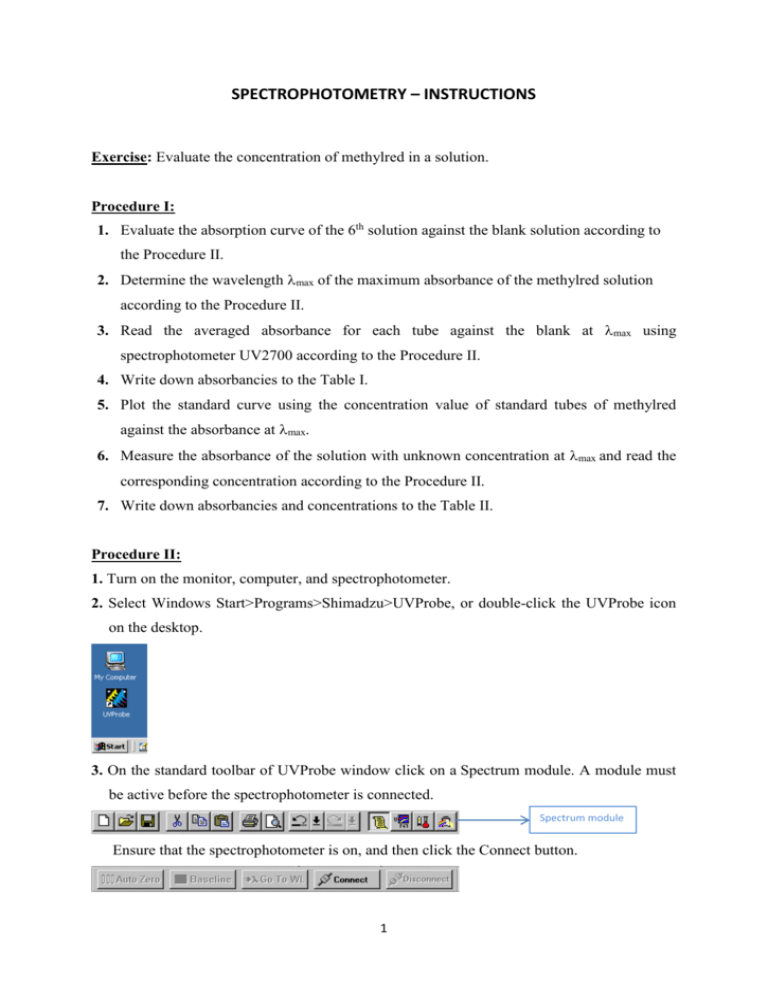
SPECTROPHOTOMETRY – INSTRUCTIONS Exercise: Evaluate the concentration of methylred in a solution. Procedure I: 1. Evaluate the absorption curve of the 6th solution against the blank solution according to the Procedure II. 2. Determine the wavelength max of the maximum absorbance of the methylred solution according to the Procedure II. 3. Read the averaged absorbance for each tube against the blank at max using spectrophotometer UV2700 according to the Procedure II. 4. Write down absorbancies to the Table I. 5. Plot the standard curve using the concentration value of standard tubes of methylred against the absorbance at max. 6. Measure the absorbance of the solution with unknown concentration at max and read the corresponding concentration according to the Procedure II. 7. Write down absorbancies and concentrations to the Table II. Procedure II: 1. Turn on the monitor, computer, and spectrophotometer. 2. Select Windows Start>Programs>Shimadzu>UVProbe, or double-click the UVProbe icon on the desktop. 3. On the standard toolbar of UVProbe window click on a Spectrum module. A module must be active before the spectrophotometer is connected. Spectrum module Ensure that the spectrophotometer is on, and then click the Connect button. 1 When connected to the instrument, the Connect button changes to Start and the Photometer buttons become active, as shown in the next figure. If instrument initialization has not yet completed when connecting to the spectrophotometer, a window similar to the following may appear. When necessary, click OK when initialization is complete. 4. The Spectrum window is divided into panes, with the Operation pane in the upper left, the Graph pane to the right, and the Method pane in the bottom left. 5. Set and edit Spectrum Method. Click on Method Tool (M) on the Spectrum Toolbar Method Tool to display the Spectrum Method dialog box. 6. To set the Wavelength Range (nm), enter 560 in the Start box and 400 in the End box. Select Medium in the Scan Speed list. Select 5.0 in the Sampling Interval list. This will set 2 the machine to take a reading every 5.0 nm. Click Single under Scan mode to take a single reading across the selected Wavelength Range. 7. Click the Instrument Parameters table on Spectrum Method. Select Absorbance in the Measuring Mode box. Click OK to send the parameters to the instrument. Leave all other method settings in their default state. 8. Click the button Autozero. There are no cuvettes inside the compartment. 9. Place both cuvettes with a solution (sample 6) and a blank (sample 1) into the sample compartment of the spectrophotometer. 10. Press button Start to perform a spectral scan. When the scan is complete, enter the file name in the New Data Set dialog box that appears onscreen and click OK. 11. Click on the Data Print button to display all of the data in the Operation pane. Data Print 12. Click on the icon Peak Pick to display the wavelength corresponding to the peak of the maximal absorbance. Write down the wavelength corresponding to the peak of the maximal absorbance max. 13. On the standard toolbar of UVProbe window click on a Photometric module. A module must be active before the spectrophotometer is connected. Photometric module 14. The photometric module includes four panes: Standard table, Standard Curve, Sample/S.E.P. table, and Sample graph. 3 15. Set and edit Photometric Method. Click on Method Tool (M) on the Photometric Toolbar. Method Tool Then Photometric Method Wizard starts. 16. Complete the method according to the instructions of wizard: 17. Select Point in the Wavelength Type box. In the Wavelength (nm) box, enter max (wavelength corresponding to the peak of the maximal absorbance from the previous procedure) and click Add to specify the wavelength, where the data will be collected. Click the Next button. 4 18. In the Type box, select Multi Point. In the Formula box, select Fixed wavelength. In the WL1 box, select WL/max/. In the Units box write down units – µmol/l. Choose Abs=f(Conc). In the Order of Curve box, select 1rd and mark Zero Interception. Click Next. 19. Measurement parameter page for standard sample table will appear. In this page, select data acquisition method - by instrument. Sample repetition set to 2 or 3. Leave all other settings at the default and click the Next button. 20. Measurement parameter page for unknown sample table will appear. In this page, select data acquisition method - by instrument. Sample repetition set to 2 or 3. Leave all other settings at the default and click the Next button. 21. File Property page will appear. Do not change anything and click Finish button. 22. Photometric method window opens. Click Instrument Parameter table. 5 Select Absorbance as the Measuring Mode. In the Slit Width (nm) box, select 2.0. Leave all other settings at the default. Click Close. Verify that both the Standard and Sample tables now include columns labeled WL/max/. 23. Click anywhere in the Standard table to activate it. (Active) will display in the header. Enter standard table sample IDs (Test sample No from Table I) and concentration (Concentration of methylred solution from Table I). Now take a reading of the standard samples and unknown samples. 24. Press the button Autozero. There are no cuvettes in the compartment. 25. Place an empty cuvette into the compartment. Press the button Cell blank. On the Cell Blank Data click OK. 26. Place the first standard and a blank into the sample compartment of the spectrophotometer. Click the Read Std. Button, or push the F9 key. (NOTE: When the following message displays, click Yes. “There is no associated blank for this standard. Do you wish to continue?”). The spectrophotometer will slew to each wavelength, measure the absorbance, and UVProbe will enter the WL/max/ values into the Standard table. 27. Place each of the five standard samples into the sample compartment after slewing is complete to take a reading. Now the curve created from the Standard table will be viewed. (To change the number of decimal places choose: Settings>General) 28. Right-click anywhere in the Standard Curve pane. Choose Properties. Mark Equotion and Correlation coef. boxes. Write down the equation corresponding to the standard curve as well as the correlation coefficient. 29. Click anywhere in the Sample table to activate it. (Active) should display in the header. Enter the values into the Sample ID column (Test sample No from Table II). 30. Place a sample and a blank into the sample compartment of the spectrophotometer. 31. Click the Read Unk button. 32. Repeat this procedure for the remaining samples. Notice averaged absorbance in the column WL/max/. Write down results into the Table II. 33. Save the Data. Select File>Save as. 34. Click on the Disconnect button. 35. Exit UVProbe. Select File>Exit. 6
