April 2014 Benchmark Study Guide 1.Eubacteria and
advertisement
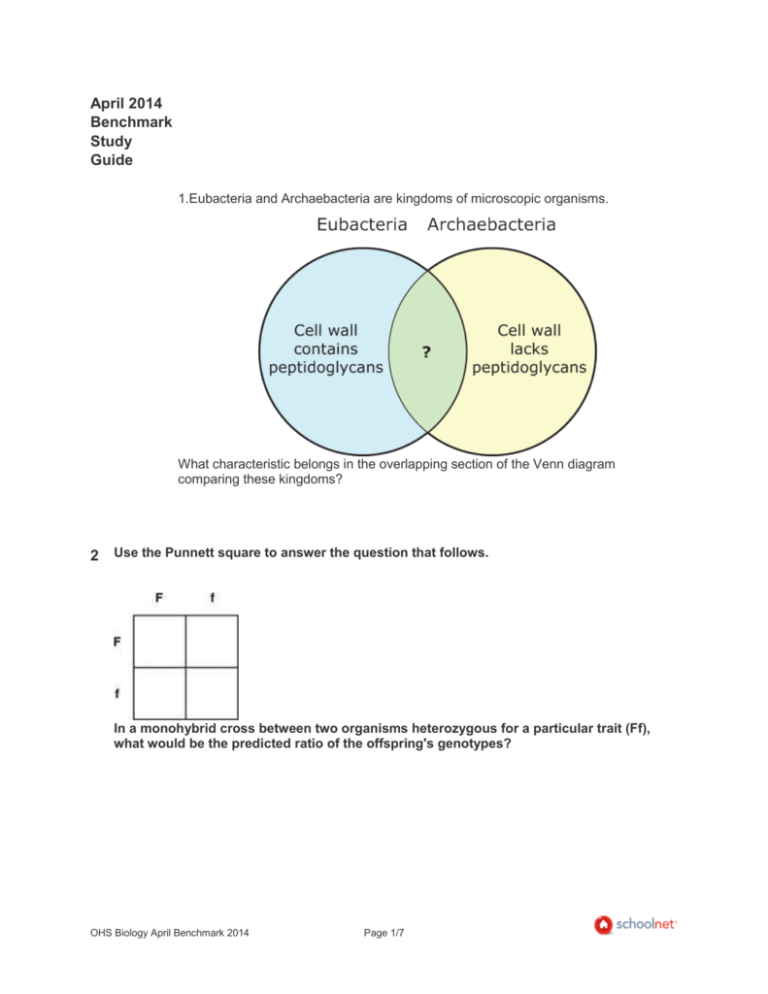
April 2014 Benchmark Study Guide 1.Eubacteria and Archaebacteria are kingdoms of microscopic organisms. What characteristic belongs in the overlapping section of the Venn diagram comparing these kingdoms? 2 Use the Punnett square to answer the question that follows. In a monohybrid cross between two organisms heterozygous for a particular trait (Ff), what would be the predicted ratio of the offspring's genotypes? OHS Biology April Benchmark 2014 Page 1/7 3. A portion of a nucleic acid is represented by the diagram below. What conclusion would best explain the absence of thymine from the nucleic acid? 4. An RNA codon chart is shown. What is the correct amino acid sequence that is coded from the RNA sequence UGGCAGAUA? OHS Biology April Benchmark 2014 Page 2/7 5. The diagram shows a cellular process in which a double-stranded molecule of nucleic acid gives rise to a single-stranded molecule of nucleic acid. Which best describes the process shown? 6. Taxonomy, the science of classifying living things, is based on related organisms having similar structures or patterns evident at some level of observation. The drawings represent organisms that are related. Which organizational pattern do the organisms share? 7. Use the information in the table to answer the question that follows. Scientific Classification Kingdom Animalia Phylum Chordata OHS Biology April Benchmark 2014 Page 3/7 Class Reptillia Order Testudines Family Emydidae Genus Terrapine Species Virginia What is the correct scientific name for the organism classified above? 8. This food chain diagram shows some predator-prey relationships in a wetland ecosystem. Plants → Insects → Small Fish → Frogs → Wading Birds Based on the diagram, if the population of frogs were to increase, which populations of organisms would immediately begin to have fewer individuals? 9. In the food chain shown, which organism is feeding on a heterotroph? An autotroph? 10. OHS Biology April Benchmark 2014 The diagram below shows an energy pyramid. Page 4/7 Some energy is lost as it is transferred from one level of the pyramid to the next. At what level will the total amount of usable chemical energy be approximately 10% of the amount found at Level 3? 11. How many trophic levels do food pyramids based on most ecosystems have? 12. A food web shows an arrow that points from a frog to a fly. What does the arrow indicate? 13. If a newly found species were eukaryotic, multicellular, and autotrophic, to which kingdom would it belong? 14. Organisms with cell walls made of chitin belong to which kingdom? 15. A stream changes course so a population of beetles is subdivided into two populations. The woods on the western side of the stream contains a land predator that is absent on the eastern side of the stream. What will most likely happen to the population of beetles over many generations? OHS Biology April Benchmark 2014 Page 5/7 16. Define genetic drift. 17. What scientist presented evidence that species evolved from a single common ancestor through the process of natural selection? 18. The steps of a biological process are listed. Overproduction of offspring occurs. Genetic variation is expressed. Individuals struggle to survive. Only certain individuals successfully reproduce. What biological process do these steps describe? 19. How would you describe how genetic information moves from DNA in the nucleus to the ribosomes in the cytoplasm? 20. You observe a cell under a microscope and find that it contains membrane-bound organelles? How would you classify the cell? 21. Write the equation that describes the net process of photosynthesis. 22. What organelle is responsible for making ATP in the cell? 23. What is the relationship between cells and living things? OHS Biology April Benchmark 2014 Page 6/7 OHS Biology April Benchmark 2014 Page 7/7
