C-2 Creating a Climatogram
advertisement
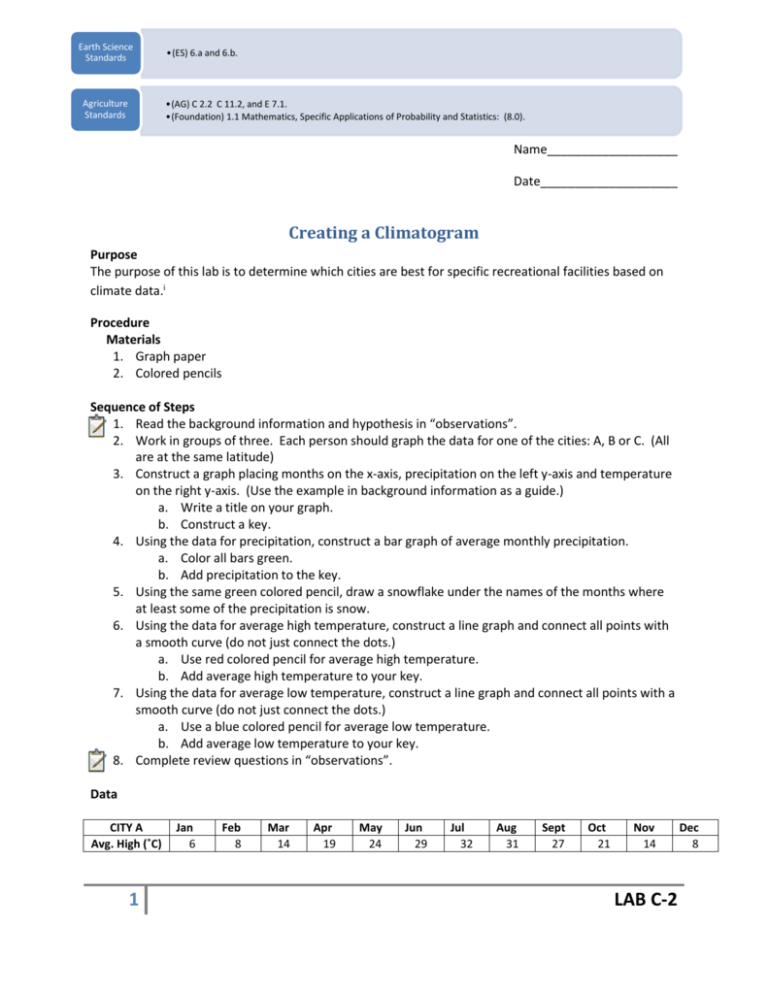
Earth Science Standards Agriculture Standards •(ES) 6.a and 6.b. •(AG) C 2.2 C 11.2, and E 7.1. •(Foundation) 1.1 Mathematics, Specific Applications of Probability and Statistics: (8.0). Name___________________ Date____________________ Creating a Climatogram Purpose The purpose of this lab is to determine which cities are best for specific recreational facilities based on climate data.i Procedure Materials 1. Graph paper 2. Colored pencils Sequence of Steps 1. Read the background information and hypothesis in “observations”. 2. Work in groups of three. Each person should graph the data for one of the cities: A, B or C. (All are at the same latitude) 3. Construct a graph placing months on the x-axis, precipitation on the left y-axis and temperature on the right y-axis. (Use the example in background information as a guide.) a. Write a title on your graph. b. Construct a key. 4. Using the data for precipitation, construct a bar graph of average monthly precipitation. a. Color all bars green. b. Add precipitation to the key. 5. Using the same green colored pencil, draw a snowflake under the names of the months where at least some of the precipitation is snow. 6. Using the data for average high temperature, construct a line graph and connect all points with a smooth curve (do not just connect the dots.) a. Use red colored pencil for average high temperature. b. Add average high temperature to your key. 7. Using the data for average low temperature, construct a line graph and connect all points with a smooth curve (do not just connect the dots.) a. Use a blue colored pencil for average low temperature. b. Add average low temperature to your key. 8. Complete review questions in “observations”. Data CITY A Avg. High (˚C) 1 Jan 6 Feb 8 Mar 14 Apr 19 May 24 Jun 29 Jul 32 Aug 31 Sept 27 Oct 21 Nov 14 LAB C-2 Dec 8 Avg. Low (˚C) Avg. Precip. Snow -3 6.9 Snow -2 6.9 Snow 3 8.1 Snow 8 6.9 Trace 14 9.4 None 19 8.6 None 22 9.7 None 21 9.9 None 17 8.4 None 10 7.6 Trace 5 7.9 Snow 0 7.9 Snow CITY B Avg. High (˚C) Avg. Low (˚C) Avg. Precip. Snow Jan 13 8 10.4 Trace Feb 16 9 7.6 Trace Mar 16 9 7.9 Trace Apr 17 10 3.5 None May 17 11 0.8 None Jun 18 12 0.5 None Jul 18 12 0.3 None Aug 19 13 0.3 None Sept 21 13 0.8 None Oct 21 13 3.3 None Nov 17 11 8.1 None Dec 13 8 7.9 Trace CITY C Avg. High (˚C) Avg. Low (˚C) Avg. Precip. Snow Jan 7 -6 2.5 Snow Feb 11 -4 2.3 Snow Mar 13 -2 1.8 Snow Apr 18 1 1.3 Snow May 21 4 1.8 Snow Jun 28 8 1 Trace Jul 33 11 0.8 None Aug 32 10 0.5 None Sept 27 6 0.8 Trace Oct 21 1 1 Trace Nov 12 -3 2 Snow Dec 8 -7 2.5 Snow Observations BACKGROUND: Climate is the long term conditions of temperature and precipitation in an area. This information can be used not only for scientific research, but to determine where the best locations are for recreational facilities such as water parks, ski parks, mountain climbing parks, etc. This is mostly common sense. For example, you would probably not spend the money to build a snow board and snow ski park in Mexico. By the same token, you would probably not build a water park in Alaska. In determining the best locations for various facilities, climatograms are very helpful because the information you need is all together in one place for you to look at all at one time. HYPOTHESIS: If average high monthly temperature, average low monthly temperature, average precipitation and whether or not there was snowfall are plotted on a graph, then it can be determined which recreational facilities are best for each area. ANALYSIS: (Answer the following with complete sentences using actual data. When asked to calculate write the formula, show the complete set up and express your answer with appropriate units.) 2 LAB C-2 1. Calculate the average precipitation for each city. To do this: add precipitation for all months, and then divide by 12. City A City B City C 2. Which city has most constant temperature over the course of the year? Explain. 3. Which city has the greatest change in temperature over the course of the year? Explain. 4. The three cities are at the same latitude, but which city is probably closest to an ocean? Explain. 3 LAB C-2 5. The three cities are at the same latitude, but which city is probably in the middle of the continent? Explain. 6. Which city would be the best choice for a water park? Explain 7. Which city would be the best choice for a cross-country ski center? Explain. 8. What other factors would you need to take into consideration in determining the ideal facility for each city? Explain. 9. Which city would be the best choice for producing crops? What additional information would you need? 10. Investigation: Using the internet, or other classroom resources, determine 2 agricultural commodities which could be produced in each city based on the climate knowledge you now have. i Looper, Jim (2008). Creating a Climatogram, Lab. Sheldon High School Science Dept. 4 LAB C-2


