Answers to the Problems and Applications
advertisement

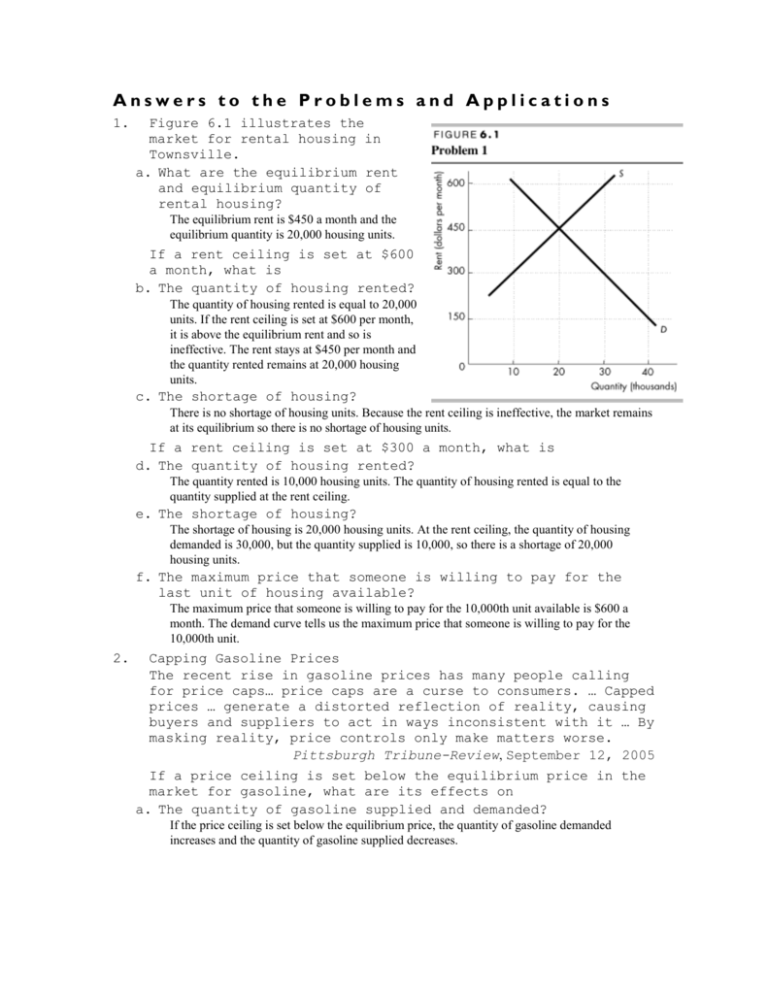
Answers to the Problems and Applications 1. Figure 6.1 illustrates the market for rental housing in Townsville. a. What are the equilibrium rent and equilibrium quantity of rental housing? The equilibrium rent is $450 a month and the equilibrium quantity is 20,000 housing units. If a rent ceiling is set at $600 a month, what is b. The quantity of housing rented? The quantity of housing rented is equal to 20,000 units. If the rent ceiling is set at $600 per month, it is above the equilibrium rent and so is ineffective. The rent stays at $450 per month and the quantity rented remains at 20,000 housing units. c. The shortage of housing? There is no shortage of housing units. Because the rent ceiling is ineffective, the market remains at its equilibrium so there is no shortage of housing units. If a rent ceiling is set at $300 a month, what is d. The quantity of housing rented? The quantity rented is 10,000 housing units. The quantity of housing rented is equal to the quantity supplied at the rent ceiling. e. The shortage of housing? The shortage of housing is 20,000 housing units. At the rent ceiling, the quantity of housing demanded is 30,000, but the quantity supplied is 10,000, so there is a shortage of 20,000 housing units. f. The maximum price that someone is willing to pay for the last unit of housing available? The maximum price that someone is willing to pay for the 10,000th unit available is $600 a month. The demand curve tells us the maximum price that someone is willing to pay for the 10,000th unit. 2. Capping Gasoline Prices The recent rise in gasoline prices has many people calling for price caps… price caps are a curse to consumers. … Capped prices … generate a distorted reflection of reality, causing buyers and suppliers to act in ways inconsistent with it … By masking reality, price controls only make matters worse. Pittsburgh Tribune-Review, September 12, 2005 If a price ceiling is set below the equilibrium price in the market for gasoline, what are its effects on a. The quantity of gasoline supplied and demanded? If the price ceiling is set below the equilibrium price, the quantity of gasoline demanded increases and the quantity of gasoline supplied decreases. b. The quantity of gasoline sold and the shortage or surplus of gasoline? With the increase in the quantity demanded and the decrease in quantity supplied, a shortage of gasoline is created. The quantity of gasoline sold decreases from the equilibrium quantity before the price ceiling to equal the quantity supplied at the ceiling price. c. The maximum price that someone is willing to pay for the last gallon of gasoline available on a black market? The maximum price someone is willing to pay for the last gallon of gasoline available is determined by the height of the demand curve. The demand curve is upward sloping, so when the quantity of gasoline available decreases, the maximum price that someone is willing to pay for the last gallon available increases. d. Draw a demand and supply graph to illustrate the effects of a price ceiling set below the equilibrium price in the market for gasoline. Figure 6.2 shows the effect of a price ceiling set below the equilibrium price in the market for gasoline. At the ceiling price there is a shortage because the quantity of gasoline demanded, 100 million gallons in the figure, exceeds the quantity of gasoline supplied, 98 million gallons per day. 3. Explain the various ways in which a price ceiling on gasoline that is set below the equilibrium price would make buyers and sellers of gasoline better off or worse off. What would happen to total surplus and deadweight loss in this market? A price ceiling set below the equilibrium price benefits some consumers and harms others. Consumers who are able to buy gasoline at the price ceiling without too much search activity or have a low cost of search are made better off. Consumers who cannot buy, who must undertake extensive search activity, or who have a high cost of search are made worse off. All producers of gasoline are made worse off. The total surplus decreases and a deadweight loss is created. 4. The table gives the demand and supply schedules of teenage labor. a. What are the equilibrium wage rate and number of hours worked? The equilibrium wage rate is $6 an hour and 2,000 hours a month are worked. Wage rate (dollars per hour) 4 5 6 7 8 Quantity Quantity demanded supplied (hours per month) 3,000 1,000 2,500 1,500 2,000 2,000 1,500 2,500 1,000 3,000 b. What is the quantity of unemployment? Unemployment is zero. Everyone who wants to work for $6 an hour is employed. If a minimum wage for teenagers is set at $5 an hour c. How many hours do they work? They work 2,000 hours a month. A minimum wage rate is the lowest wage rate that a teenager can be paid for an hour of work. Because the equilibrium wage rate exceeds the minimum wage rate, the minimum wage is ineffective. The wage rate will be $6 an hour and employment is 2,000 hours. d. How many hours of teenage labor are unemployed? There is no unemployment. The wage rate rises to the equilibrium wage, the wage rate at which the quantity of labor demanded equals the quantity of labor supplied. So there is no unemployment. If a minimum wage for teenagers is set at $7 an hour, e. How many hours do teenagers work and how many hours are unemployed? At $7 an hour, 1,500 hours a month are employed and 1,000 hours a month are unemployed. The quantity of labor employed equals the quantity demanded at $7 an hour. Unemployment is equal to the quantity of labor supplied at $7 an hour minus the quantity of labor demanded at $7 an hour. The quantity supplied is 2,500 hours a month and the quantity demanded is 1,500 hours a month, so 1,000 hours a month are unemployed. f. Demand for teenage labor increases by 500 hours a month. What is the wage rate paid to teenagers and how many hours of teenage labor are unemployed? The wage rate is $7 an hour, and unemployment is 500 hours a month. At the minimum wage of $7 an hour, the quantity demanded is 2,000 hours a month and the quantity supplied is 2,500 hours a month so 500 hours a month are unemployed. 5. India Steps Up Pressure for Minimum Wage for Its Workers in the Gulf Oil-rich countries in the [Persian] Gulf, already confronted by strong labor protests, are facing renewed pressure from India to pay minimum wages for unskilled workers. The effort by India—the largest source of migrant workers in the region, with five million—is the strongest push yet by home countries to win better conditions for their citizens… International Herald Tribune, March 27, 2008 If the Persian Gulf countries paid a minimum wage above the equilibrium wage to Indian workers, a. How would the market for labor be affected in the Gulf countries? Draw a supply and demand graph to illustrate your answer. Figure 6.3 shows the outcome in the Gulf countries’ labor markets. In the figure, without a minimum wage the equilibrium wage rate is $3 per hour and 90 million hours of labor are employed. The minimum wage decreases the quantity of labor demanded, in the figure to 60 million hours of labor, and increases the quantity of labor supplied, in the figure to 150 million hours of labor. As a result, unemployment increases to 90 million hours in the figure. b. How would the market for labor be affected in India? Draw a supply and demand graph to illustrate your answer. [Be careful: the minimum wage is in the Gulf countries, not in India.] The effect on the labor market in India is ambiguous. On the one hand workers in India who learn about the higher wage rates in the Persian Gulf countries might leave India in order to work at these jobs. In this case, labor supply in India decreases and the labor supply curve in India shifts leftward. On the other hand Indian workers in the Gulf countries who are unemployed might return to India to gain employment. In this case, labor supply in India increases and the labor supply curve in India shifts rightward. c. Would migrant Indian workers be better off or worse off or unaffected by this minimum wage? Some migrant Indian workers are better off—those who retain their higher paying job or find a higher paying job without much search activity. Other migrant Indian workers are worse off— those who are fired when the wage rate rises, those who cannot find a job, and those who find a job but only after incurring much costly search activity. 6. The table gives the demand and supply schedules for chocolate brownies a. If brownies are not taxed, what is the price of a brownie and how many are bought? With no tax on brownies, the price is 60 cents a brownie and 4 million a day are bought. Price (cents per brownie) 50 60 70 80 90 Quantity Quantity demanded supplied (millions per day) 5 3 4 4 3 5 2 6 1 7 b. If sellers are taxed 20¢ a brownie, what are the price and quantity bought? Who pays the tax? The price paid by buyers, including the tax, is 70 cents a brownie, and 3 million brownies a day are bought. The price received by sellers, excluding the tax, is 50 cents a brownie. Consumers and sellers each pay 10 cents of the tax on a brownie. c. If buyers are taxed 20¢ a brownie, what are the price and quantity bought? Who pays the tax? The price received by sellers, excluding the tax, is 50 cents a brownie, and 3 million brownies a day are consumed. The price paid by buyers, including the tax, is 70 cents a brownie. Consumers and sellers each pay 10 cents of the tax. 7. Luxury Tax Heavier Burden on Working Class, It Would Seem The Omnibus Budget Reconciliation Act of 1990… included … a stern tax on “luxury items” ... In 1990 the Joint Committee on Taxation projected that the 1991 revenue yield from the luxury taxes would be $31 million. The actual yield was $16.6 million. Why? Because—surprise!—the taxation changed behavior. The Topeka Capital-Journal, October 29, 1999 a. Would buyers or sellers of “luxury items” pay more of the luxury tax? Luxury items have elastic demands. As a result the burden of a tax falls more heavily on sellers. b. Explain why the luxury tax generated far less tax revenue than was originally anticipated. Because the demand for luxury items is elastic, the decrease in the quantity bought and sold is large. With a large decrease in the quantity, the tax revenue raised is small. The anticipated amount of tax revenue assumed a much smaller decrease in the quantity. Because there was an unexpectedly large decrease in quantity, the tax revenue generated was much smaller than anticipated. 8. How to Take a Gas Holiday High fuel prices will probably keep Americans closer to home this summer, despite the gas-tax “holiday” supported by Hillary Clinton and John McCain that would shave 18 cents off every gallon of gas through Labor Day… Time, May 19, 2008 If the federal government removed the 18.4 cents per-gallon gas tax they currently impose, a. Would the price of gasoline that consumers pay fall by 18.4 cents? Explain. The price that consumers pay would not fall by the entire 18.4 cents. This result is simply the “flip” side of the result that if an 18.4 cents per gallon tax is imposed, the price consumers pay does not rise by the entire 18.4 cents. b. How would consumer surplus change? The consumer surplus would increase. Consumers would pay a lower price and would buy a greater quantity, both of which increase consumer surplus. 9. The demand and supply schedules for rice are given in the table. What are the price, the marginal cost of producing rice, and the quantity produced if the government a. Sets a production quota for rice of 2,000 boxes a week? Price (dollars per box) 1.00 1.10 1.20 1.30 1.40 1.50 1.60 Quantity Quantity demanded supplied (boxes per week) 3,500 500 3,250 1,000 3,000 1,500 2,750 2,000 2,500 2,500 2,250 3,000 2,000 3,500 With a production quota of 2,000 boxes a week, the price is $1.60 a box, the marginal cost $1.30 a box, and the quantity produced is 2,000 boxes a week. The production quota decreases the quantity supplied to 2,000 boxes a week. The price willingly paid for 2,000 boxes a week is $1.60 (given by the demand schedule). The marginal cost of producing 2,000 boxes of rice is given by the supply schedule and is $1.30 a box. b. Introduces a subsidy to rice growers of $0.30 a box? With a subsidy of $0.30 a box for rice, the price is $1.20 a box, the marginal cost $1.50 a box, and the quantity produced is 3,000 boxes a week. The subsidy of $0.30 lowers the price at which each quantity in the table is supplied. For example, rice farmers will supply 3,000 boxes a week if the price is $1.50 minus $0.30, which is $1.20. With a subsidy, the market equilibrium occurs at a price of $1.20 a box. At this price, the quantity demanded is 3,000 boxes and the quantity supplied is 3,000 boxes. The marginal cost of producing rice is given by the supply schedule and is $1.50 a box. 10. Figure 6.4 illustrates the market for a banned substance. What are the market price and quantity consumed if a penalty of $20 a unit is imposed on a. Sellers only? With a penalty of $20 a unit on sellers, the price is $70 a unit and the quantity consumed is 100 units. The $20 penalty on sellers decreases the supply. The supply curve shifts leftward so that the vertical distance between the initial supply curve and the new supply curve is $20. With this new supply curve, the equilibrium price is $70 a unit and the equilibrium quantity is 100 units. b. Buyers only? With a penalty of $20 a unit on buyers, the price is $50 a unit and the quantity consumed is 100 units. The $20 penalty on buyers decreases the demand. The demand curve shifts leftward so that the vertical distance between the initial demand curve and the new demand curve is $20. With this new demand curve, the equilibrium price is $50 a unit and the equilibrium quantity is 100 units. c. Both sellers and buyers? With a penalty of $20 a unit on sellers and on buyers, the price is $60 a unit and the quantity consumed is 90 units. The $20 penalty on sellers decreases the supply. The supply curve shifts leftward so that the vertical distance between the initial supply curve and the new supply curve is $20. The $20 penalty on buyers decreases the demand. The demand curve shifts leftward so that the vertical distance between the initial demand curve and the new demand curve is $20. With these new supply and demands curves, the equilibrium price is $60 a unit and the equilibrium quantity is 90 units.


