HL Chemistry Lab Report Format
advertisement
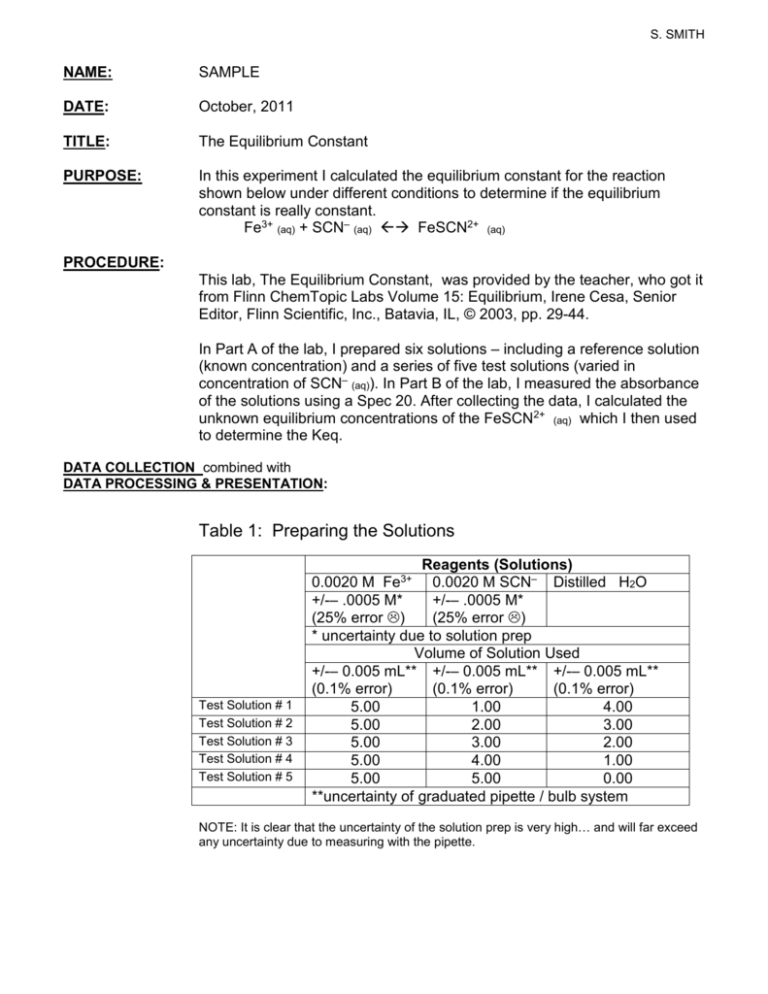
S. SMITH NAME: SAMPLE DATE: October, 2011 TITLE: The Equilibrium Constant PURPOSE: In this experiment I calculated the equilibrium constant for the reaction shown below under different conditions to determine if the equilibrium constant is really constant. Fe3+ (aq) + SCN– (aq) FeSCN2+ (aq) PROCEDURE: This lab, The Equilibrium Constant, was provided by the teacher, who got it from Flinn ChemTopic Labs Volume 15: Equilibrium, Irene Cesa, Senior Editor, Flinn Scientific, Inc., Batavia, IL, © 2003, pp. 29-44. In Part A of the lab, I prepared six solutions – including a reference solution (known concentration) and a series of five test solutions (varied in concentration of SCN– (aq)). In Part B of the lab, I measured the absorbance of the solutions using a Spec 20. After collecting the data, I calculated the unknown equilibrium concentrations of the FeSCN2+ (aq) which I then used to determine the Keq. DATA COLLECTION combined with DATA PROCESSING & PRESENTATION: Table 1: Preparing the Solutions Reagents (Solutions) 0.0020 M 0.0020 M SCN– Distilled H2O +/-– .0005 M* +/-– .0005 M* (25% error ) (25% error ) * uncertainty due to solution prep Volume of Solution Used +/-– 0.005 mL** +/-– 0.005 mL** +/-– 0.005 mL** (0.1% error) (0.1% error) (0.1% error) 5.00 1.00 4.00 5.00 2.00 3.00 5.00 3.00 2.00 5.00 4.00 1.00 5.00 5.00 0.00 **uncertainty of graduated pipette / bulb system Fe3+ Test Solution # 1 Test Solution # 2 Test Solution # 3 Test Solution # 4 Test Solution # 5 NOTE: It is clear that the uncertainty of the solution prep is very high… and will far exceed any uncertainty due to measuring with the pipette. Table 2: Initial Concentration and Measured Absorbance of Solutions Absorbance Reagents Temperature of Solutions (assumed to be room temperature): Solution Uncertainty Test Solution # 1 Test Solution # 2 Test Solution # 3 Test Solution # 4 Test Solution # 5 Reference Solution # 6 [ SCN– ] in M +/- 25 % 2.0 x 10⁻⁴ 4.0 x 10⁻⁴ 6.0 x 10⁻⁴ 8.0 x 10⁻⁴ 1.0 x 10⁻³ [ Fe3+ ] in M +/- 25 % 1.0 x 10⁻³ 1.0 x 10⁻³ 1.0 x 10⁻³ 1.0 x 10⁻³ 1.0 x 10⁻³ 0.180 2.0 x 10⁻⁴ +/- 25 % +/- 0.01 +/- 2.5 % (avg) 0.18 +/- 6 % 0.32 +/- 3 % 0.46 +/- 2 % 0.60 +/- 2 % 1.15 +/- 0.9 % 1.55 +/- 0.6 % Sample Calculations for Test Solution # 1 [ Fe3+ ] = (0.0020 M) (5.00 mL) / (10.00 mL) = 1.0 x 10⁻³ Uncertainty = 25% + 0.1% + 0.1% = 25.2 % (essentially 25% !) [ SCN1– ] = (0.0020 M) (1.00 mL) / (10.00 mL) = 2.0 x 10⁻⁴ Uncertainty = 25% + 0.1% + 0.1% = 25.2 % (essentially 25% !) Sample Calculations for Reference Solution # 6 [ Fe3+ ] = (0.200 M) (9.00 mL) / (10.00 mL) = 0.18M Uncertainty = 2.5% + 0.1% + 0.1% = 2.7 % [ SCN1– ] = (0.0020 M) (1.00 mL) / (10.00 mL) = 2.0 x 10⁻⁴ Uncertainty = 25% + 0.1% + 0.1% = 25.2 % (essentially 25% !) Table 3: Calculations of the Equilibrium values of Ions in Solutions Solution Ions in Solution at Equilibrium [ FeSCN2+ ]eq [ Fe3+ ] eq [ SCN– ] eq in M in M in M Keq Uncertainty Test Solution # 1 Test Solution # 2 Test Solution # 3 Test Solution # 4 Test Solution # 5 Reference Solution 2.3 x 10⁻⁵ M +/- 32% 4.1 x 10⁻⁵ M +/- 29% 5.9 x 10⁻⁵ M +/- 28% 7.7 x 10⁻⁵ M +/- 28% 1.5 x 10⁻⁴ M +/- 27% 2.0 x 10⁻⁴ M +/- 25 % 9.77 x 10⁻⁴ M +/- 25% 9.59 x 10⁻⁴ M +/- 25% 9.41 x 10⁻⁴ M +/- 25% 9.23 x 10⁻⁴ M +/- 25% 8.5 x 10⁻⁴ M +/- 25% 1.77 x 10⁻⁴ M +/- 32% 3.59 x 10⁻⁴ M +/- 17% 5.41 x 10⁻⁴ M +/- 12% 7.23 x 10⁻⁴ M +/- 10% 8.50 x 10⁻⁴ M +/- 10% 2.0 x 10⁻⁴ M +/- 11% Average Value 133 +/- 89% 119 +/- 71% 116 +/- 65% 115 +/- 63% 208 +/- 62% 138 +/- 70% Sample Calculations Reference Solution [ FeSCN2+ ]eq = 2.0 x 10⁻⁴ M +/- 25 % Because we infer that an excess of the [ Fe3+ ] will shift the equilibrium in such a way that all of the [ SCN1– ] is converted. Test Solution 1 [ FeSCN2+ ]eq = (A1/Aref) x [ FeSCN2+ ]ref = (0.18 / 1.55) x 2.0 x 10–4 M = 2.3 x 10⁻⁵ M Uncertainty = 6% + 0.6% + 25% = 31.6% = 32% = [ Fe3+ ]initial – [ FeSCN2+ ]eq = 1.0 x 10⁻³ – 2.3 x 10–5 = 9.77 x 10⁻⁴ M Uncertainty = 0.00025 M + 0.0000074 M ~ 0.00025 M = 25% Test Solution 1 [ Fe3+ ]eq Test Solution 1 [ SCN1- ]eq = [SCN1-]initial – [ FeSCN2+ ]eq = 2.0 x 10⁻⁴ – 2.3 x 10–5 = 1.77 x 10⁻⁴ M Uncertainty = 0.00005 M + 0.0000074 M = 0.0000574 M ~ 32% Test Solution 1 Keq = = = Uncertainty = ____[ FeSCN2+ ]eq____ [ Fe3+ ]eq x [ SCN1- ]eq ( 2.3 x 10⁻⁵ M ) / (9.77 x 10⁻⁴ M ) (1.77 x 10⁻⁴ M) 133 32% + 25% + 32 % = 89% Percent Error Calculation [ (138 – 150) /150 ] x 100 = 8.0% CONCLUSION: In this lab, the equilibrium constant for the following reaction: Fe3+ (aq) + SCN– (aq) FeSCN2+ (aq) was determined to be 138 +/- 70% or 138 +/- 97. This means that the Keq value could have been as low as 41 or as high as 235. Although my results for each trial varied from 115 to 208, each trial’s Keq is well within the uncertainty. The standard deviation XXXX This means that the equilibrium constant is, indeed, constant… within the parameters of this experiment. Unfortunately the 70% uncertainty makes it difficult to really value this information. (see evaluation for more discussion) The actual value expected for this reaction is 150, as provided by my instructor who obtained this information from the teacher’s guide of the lab book. My value of 138 is within 8.0 % of the ‘known’ value, indicating a moderate degree of accuracy – well within the 70% uncertainty. Note: Units for the Keq would be M. I choose not to report these units as they seem nonsensical. EVALUATION: SOURCES OF ERROR and SUGGESTIONS FOR IMPROVEMENT: The primary source of error in this lab seems to be due to random error. The majority of the 70% error stems from the 25% uncertainty in the stock solution of the 0.0020 M Fe3+ and 0.0020 M SCN–. Part of this uncertainty was ‘estimated’ by the teacher as a combination of 2 factors: the solutions were stock solutions on the shelf – probably sitting for more than 9 months AND the gram amounts of initial compound were measured using a mg balance (0.001g) instead of an analytical balance (0.0001g). If these solutions had been prepared more recently and more carefully (perhaps using an analytical balance) the uncertainty could have been significantly reduced. Reducing the uncertainty by a factor of 10 could have put the uncertainty near the range of the experimental error (7% random error compared to 8% experimental error).* *IF this had happened I would be looking at an experimental error just slightly higher than the random error, which would mean I would need to explain the somewhat lower results. The next most likely reason for error is in the mixing of the solutions. Although graduated pipettes are more accurate than graduated cylinders, this was the first time that I had used this equipment and am not convinced I was totally accurate and precise in my handling of the bulb and pipette combination. If I delivered less of the solution than I intended, it would cause less of the colored FeSCN2+ (aq) to be produced… resulting in a lower Keq overall. If I delivered more of the solution than I intended, it would cause more of the colored FeSCN2+ (aq) to be produced… resulting in a higher Keq overall. I do not think there were any systematic errors, as the directions were easy to follow and the other equipment was easy to use with minimal practice. The temperature was recorded and did not change therefore had no impact.
