Practice Questions for the Examination Part One – The Production
advertisement
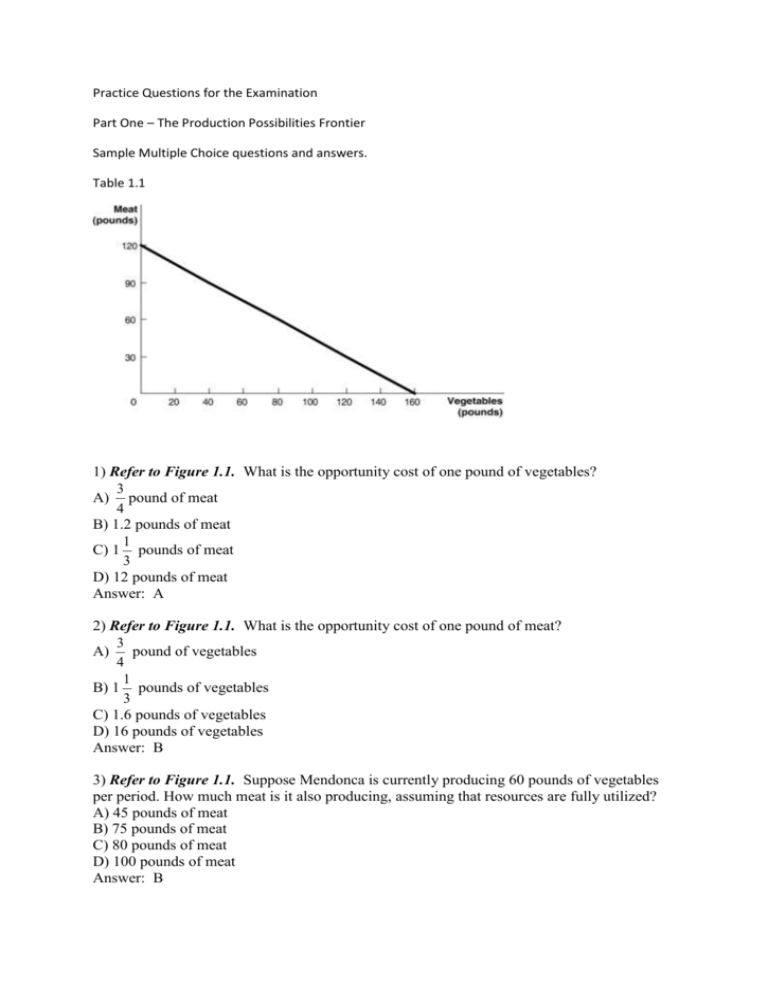
Practice Questions for the Examination Part One – The Production Possibilities Frontier Sample Multiple Choice questions and answers. Table 1.1 1) Refer to Figure 1.1. What is the opportunity cost of one pound of vegetables? 3 A) pound of meat 4 B) 1.2 pounds of meat 1 C) 1 pounds of meat 3 D) 12 pounds of meat Answer: A 2) Refer to Figure 1.1. What is the opportunity cost of one pound of meat? 3 A) pound of vegetables 4 1 B) 1 pounds of vegetables 3 C) 1.6 pounds of vegetables D) 16 pounds of vegetables Answer: B 3) Refer to Figure 1.1. Suppose Mendonca is currently producing 60 pounds of vegetables per period. How much meat is it also producing, assuming that resources are fully utilized? A) 45 pounds of meat B) 75 pounds of meat C) 80 pounds of meat D) 100 pounds of meat Answer: B Table 1.2 4) Refer to Figure 1.2. What is the opportunity cost of producing 1 pound of cashews in Indonesia? A) 3/8 of a bolt of cotton B) 5/8 of a bolt of cotton C) 2 2/3 bolts of cotton D) 320 bolts of cotton Answer: C 5) Refer to Figure 1.2. Which country has a comparative advantage in the production of cotton? A) Indonesia B) They have equal productive abilities. C) Pakistan D) neither country Answer: A 6) Refer to Figure 1.2. Which country has a comparative advantage in the production of cashews? A) Indonesia B) They have equal productive abilities. C) Pakistan D) neither country Answer: C Sample Short answer Questions and Model Answers 1. Draw a circular-flow diagram representing the interactions between households and firms in a simple economy. Explain briefly the various parts of the diagram. 2) .Draw a production possibilities frontier showing increasing opportunity cost for hammers in terms of horseshoes. a. On the graph, identify the area of feasible outcomes and the area of infeasible outcomes. b. On the graph, label a point that is efficient as point "E" and a point that is inefficient as point "I". c. On the graph, illustrate the effect of the discovery of a new vein of iron ore, a resource needed to make both horseshoes and hammers, on this economy. d. On a second graph, illustrate the effect of a new computerized assembly line in the production of hammers on this economy. ANS: Part 2 - Supply and Demand Loose Leaf Tea Price per lb. (dollars) $8 6 5 4 3 Sunil's Quantity Demanded (lbs) 4 7 9 12 15 Mia's Rest of Market Quantity Quantity Demanded Demanded (lbs) (lbs) 0 30 2 40 3 51 5 64 8 90 Market Quantity Demanded (lbs) 1) Refer to Table 3-1. The table above shows the demand schedules for loose-leaf tea of two individuals (Sunil and Mia) and the rest of the market. At a price of $5, the quantity demanded in the market would be A) 51 lbs. B) 63 lbs. C) 76 lbs D) 146 lbs. Answer: B 2) Refer to Table 3-1. The table above shows the demand schedules for loose-leaf tea of two individuals (Sunil and Mia) and the rest of the market. If the price of loose-leaf tea rises from $3 to $4, the market quantity demanded would A) decrease by 32 lbs. B) increase by 64 lbs. C) increase by 32 lbs. D) decrease by 64 lbs. Answer: A Sample Short Answer Question 3.This question deals with demand and supply and refers you to the table below. a. Given the table, graph the demand and supply curves for flashlights. Make certain to label equilibrium price and equilibrium quantity. Price $5 $4 $3 $2 $1 Quantity Demanded/Month 6,000 8,000 10,000 12,000 14,000 Quantity Supplied/Month 10,000 8,000 6,000 4,000 2,000 b. What is the equilibrium price and equilibrium quantity? c. Suppose the price is currently at $5. What problem would exist in the economy? What would you expect to happen to price? Show this on your graph. d. Suppose the price is currently $2. What problem exists in the economy? What would you expect to happen to price? Show this on your graph. ANS: a. b. Equilibrium price would be $4 and equilibrium quantity would be 8,000. c. A surplus of 4,000 flashlights would be the problem in the economy and we would expect the price to fall. d. A shortage of 8,000 flashlights would be the problem in the economy and we would expect the price to rise 20) Refer to Figure 4-6. What area represents consumer surplus after the imposition of the price floor? A) A + B + E B) A + B C) A + B + E + F D) A Answer: D 21) Refer to Figure 4-6. What is the area that represents producer surplus after the imposition of the price floor? A) A + B + E B) B + E C) B + E + F D) B + C + D + E Answer: B 22) Refer to Figure 4-6. What area represents the portion of consumer surplus that has been transferred to producer surplus as a result of the price floor? A) B B) B + C C) B + E D) E Answer: A 23) Refer to Figure 4-6. What area represents the deadweight loss after the imposition of the price floor? A) C + D + G B) F + G C) C + D D) C + D + F + G Answer: C 1.Using a supply-demand diagram, show a labor market with a binding minimum wage. Now, use the diagram to show those who are helped by the minimum wage, and those who are hurt by the minimum wage. ANS: Those helped by the minimum wage are the workers who are still employed, but now receive the higher wage. In the diagram, those would be measured by the quantity of labor demanded at the minimum wage. Those who are hurt by the minimum wage are those who are now unemployed. These workers are measured as the difference between the quantity of labor supplied and the quantity demanded at the minimum wage. The perceptive student might note that the unemployed group can be divided into those who lose their jobs as a result of the minimum wage (the competitive equilibrium quantity of labor minus the quantity demanded at the minimum wage), and those who enter the market as a result of the higher wage, but cannot find employment (quantity of labor supplied at the minimum wage minus the competitive equilibrium quantity). The buyers of the labor (employers) are also worse off because they have to pay a higher wage for labor and, hence, hire a smaller quantity. Using the graph shown, answer the following questions. a. What was the equilibrium price in this market before the tax? b. What is the amount of the tax? c. How much of the tax will the buyers pay? d. How much of the tax will the sellers pay? e. How much will the buyer pay for the product after the tax is imposed? f. How much will the seller receive after the tax is imposed? g. As a result of the tax, what has happened to the level of market activity? ANS: a. b. c. d. e. f. g. $10 $3 $1 $2 $11 $8 As a result of the tax, the level of market activity has fallen, from 100 units being bought and sold to only 90 units being bought and sold. 2.Using a supply and demand diagram, demonstrate how a positive externality leads to market inefficiency. How might the government help to eliminate this inefficiency? ANS: When a positive externality exists, the private value (or demand curve) is less than the social value. The market equilibrium quantity will be less than the socially optimal quantity. The government could help eliminate this inefficiency by subsidizing the product. In this example, the size of the per-unit subsidy would be P3 - P1. 139.Refer to Figure 7-7. Which area represents consumer surplus when the price is P1? a. A b. B c. C d. D ANS: B 140. Refer to Figure 7-7. Which area represents producer surplus when the price is P1? a. A b. B c. C d. D ANS: C 141. Refer to Figure 7-7. Which area represents total surplus in the market when the price is P1? a. A + B b. B + C c. C + D d. A + B + C + D ANS: B 2.Tammy loves donuts. The table shown reflects the value Tammy places on each donut she eats: VALUE OF FIRST DONUT VALUE OF SECOND DONUT VALUE OF THIRD DONUT VALUE OF FOURTH DONUT VALUE OF FIFTH DONUT VALUE OF SIXTH DONUT $0.60 $0.50 $0.40 $0.30 $0.20 $0.10 a. Use this information to construct Tammy's demand curve for donuts. b. If the price of donuts is $0.20, how many donuts will Tammy buy? c. Show Tammy's consumer surplus on your graph. How much consumer surplus would she have at a price of $0.20? d. If the price of donuts rose to $0.40, how many donuts would she purchase now? What would happen to Tammy's consumer surplus? Show this change on your graph. ANS: a. b. At a price of $0.20, Tammy would buy 5 donuts. c. The figure below shows Tammy's consumer surplus. At a price of $0.20, Tammy's consumer surplus would be $1.00. d. If the price of donuts rose to $0.40, Tammy's consumer surplus would fall to $0.30 and she would purchase only 3 donuts.


