View/Download Now! - SysMat Soft Solutions
advertisement
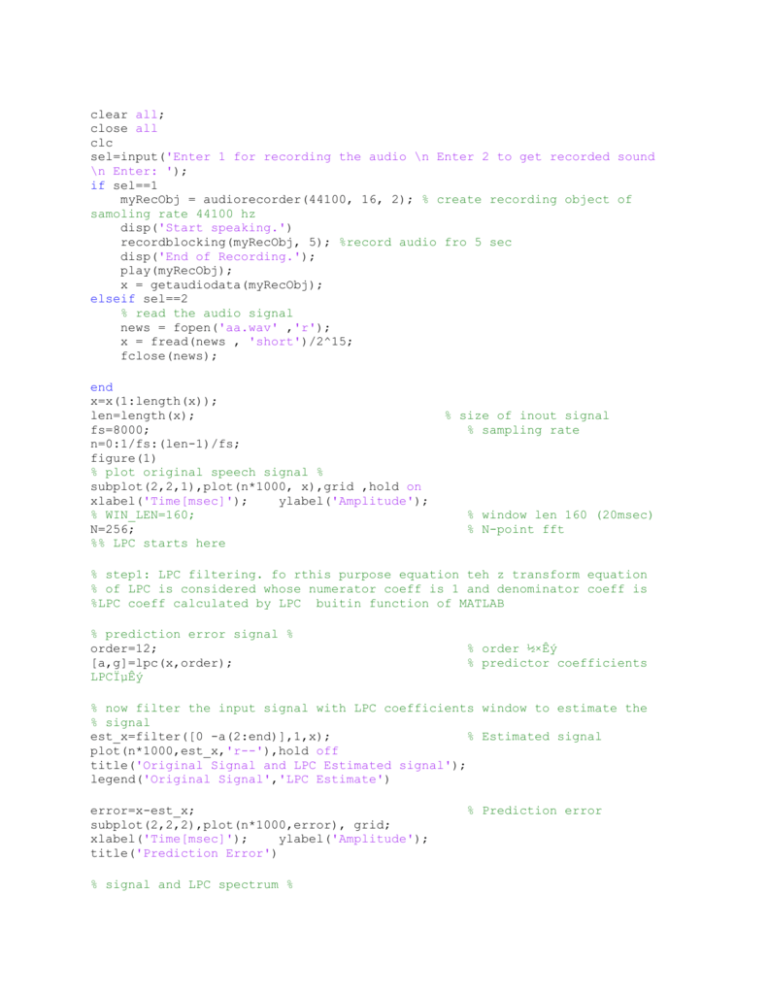
clear all;
close all
clc
sel=input('Enter 1 for recording the audio \n Enter 2 to get recorded sound
\n Enter: ');
if sel==1
myRecObj = audiorecorder(44100, 16, 2); % create recording object of
samoling rate 44100 hz
disp('Start speaking.')
recordblocking(myRecObj, 5); %record audio fro 5 sec
disp('End of Recording.');
play(myRecObj);
x = getaudiodata(myRecObj);
elseif sel==2
% read the audio signal
news = fopen('aa.wav' ,'r');
x = fread(news , 'short')/2^15;
fclose(news);
end
x=x(1:length(x));
len=length(x);
fs=8000;
n=0:1/fs:(len-1)/fs;
figure(1)
% plot original speech signal %
subplot(2,2,1),plot(n*1000, x),grid ,hold on
xlabel('Time[msec]');
ylabel('Amplitude');
% WIN_LEN=160;
N=256;
%% LPC starts here
% size of inout signal
% sampling rate
% window len 160 (20msec)
% N-point fft
% step1: LPC filtering. fo rthis purpose equation teh z transform equation
% of LPC is considered whose numerator coeff is 1 and denominator coeff is
%LPC coeff calculated by LPC buitin function of MATLAB
% prediction error signal %
order=12;
[a,g]=lpc(x,order);
LPCϵÊý
% order ½×Êý
% predictor coefficients
% now filter the input signal with LPC coefficients window to estimate the
% signal
est_x=filter([0 -a(2:end)],1,x);
% Estimated signal
plot(n*1000,est_x,'r--'),hold off
title('Original Signal and LPC Estimated signal');
legend('Original Signal','LPC Estimate')
error=x-est_x;
subplot(2,2,2),plot(n*1000,error), grid;
xlabel('Time[msec]');
ylabel('Amplitude');
title('Prediction Error')
% signal and LPC spectrum %
% Prediction error
f=0:fs/N:fs/2-1;
% half frequency
X=abs(fft(x,N));
X_LOG=20*log10(X);
% LOG (db) of signal
spectrum
% subplot(2,2,2),plot(f/1000,X_LOG(1:N/2)),hold on
% xlabel('frequency[kHz]'),ylabel('LOG(db)')
EST_X=freqz(1,a,N/2);
EST_X_LOG=20*log10(abs(EST_X));
% LPC spectrum
% plot(f/1000,EST_X_LOG(1:N/2),'r'),hold off
% title('Signal and LPC spectrum')
% error spectrum %
ERROR=abs(fft(error,N));
ERROR_LOG=20*log10(ERROR);
subplot(2,2,3),plot(f/1000,ERROR_LOG(1:N/2)), grid
xlabel('frequency[kHz]'),ylabel('LOG(db)')
title('Error spectrum')
subplot(2,2,4)
%% step2: autocorrelation anlysis : auto correlate each frame of windowed
signal
rr=xcorr(x);
%rr=rr(240:479);
rr=rr(length(x):end);
%% step3: LPC analysis using Durbin's method. it estimates the vocal tract
%resonance from a signal’s waveform, removing their effects from the speech
%signal in order to get the source signal.
%The Levinson-Durbin recursion is an algorithm for finding an all-pole IIR
%filter with a prescribed deterministic autocorrelation sequence.
%It has applications in filter design, coding, and spectral estimation.
%The filter that levinson produces is minimum phase.
%a2= coefficient of autoregressive model of order 12 as from ref paper
%E=prediction error of order 12 as from ref paper
[a2,E]=levinson(rr,order);
H2=freqz(1,a2,N/2);
H2_dB=20*log10(abs(H2));
E_dB=10*log10(E);
plot(f/1000,X_LOG(1:N/2),f/1000,H2_dB+E_dB,'r'),grid;
xlabel('frequency[kHz]'),ylabel('dB');
legend('signal spectrum','xcorr spectrum')
