You MUST use good notation Math 102 Name
advertisement
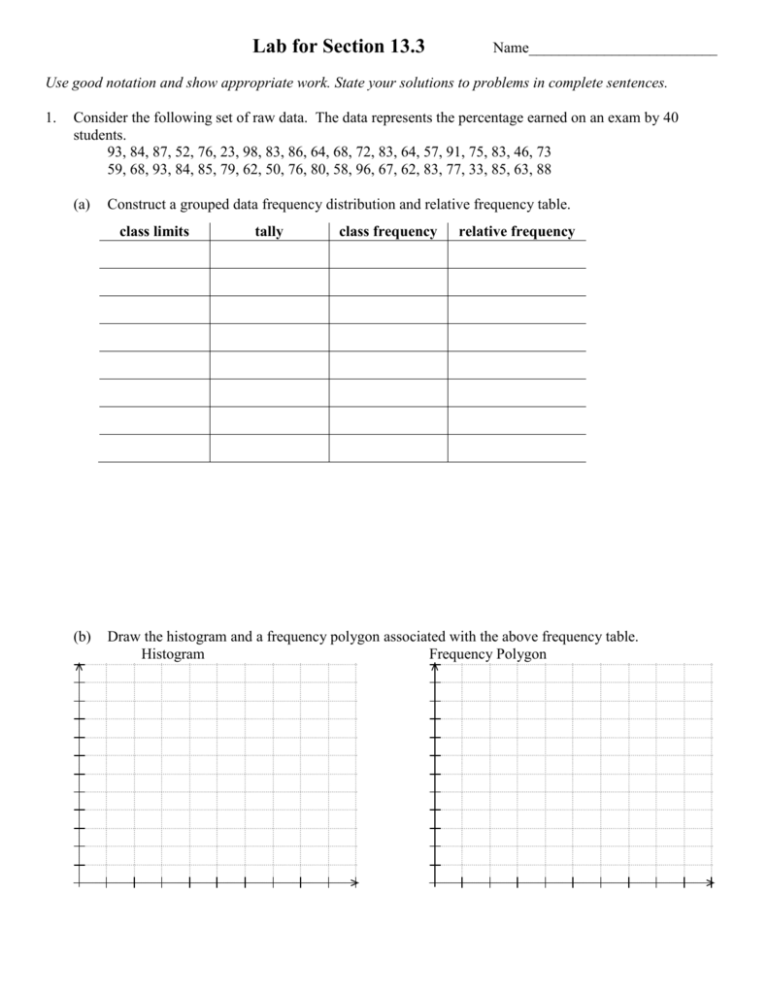
Lab for Section 13.3 Name_________________________ Use good notation and show appropriate work. State your solutions to problems in complete sentences. 1. Consider the following set of raw data. The data represents the percentage earned on an exam by 40 students. 93, 84, 87, 52, 76, 23, 98, 83, 86, 64, 68, 72, 83, 64, 57, 91, 75, 83, 46, 73 59, 68, 93, 84, 85, 79, 62, 50, 76, 80, 58, 96, 67, 62, 83, 77, 33, 85, 63, 88 (a) Construct a grouped data frequency distribution and relative frequency table. class limits (b) tally class frequency relative frequency Draw the histogram and a frequency polygon associated with the above frequency table. Histogram Frequency Polygon 2. The ages of people randomly surveyed on a college campus are summarized in the following graph. (a) Construct a frequency distribution. 10 8 6 4 2 18 19 20 21 22 23 24 25 26 over 26 (b) How many people were surveyed? (c) How many people in the survey were 22 or older? (d) How many people in the survey were older than 22? (e) How many people in the survey were under 21 years of age? 3. Agra-Chem has just conducted a comparison test of the effectiveness of two of their pesticides against corn borers. The following represents, for each pesticide, the percent of corn borers eliminated in one application. Represent the two sets of data on stem-and-leaf displays. Which pesticide, if either, seems to be more effective? Pesticide A 72 84 59 70 71 73 69 84 88 73 Pesticide B 83 74 56 59 72 70 54 60 78 58
