Template for Electronic Submission to ACS Journals
advertisement
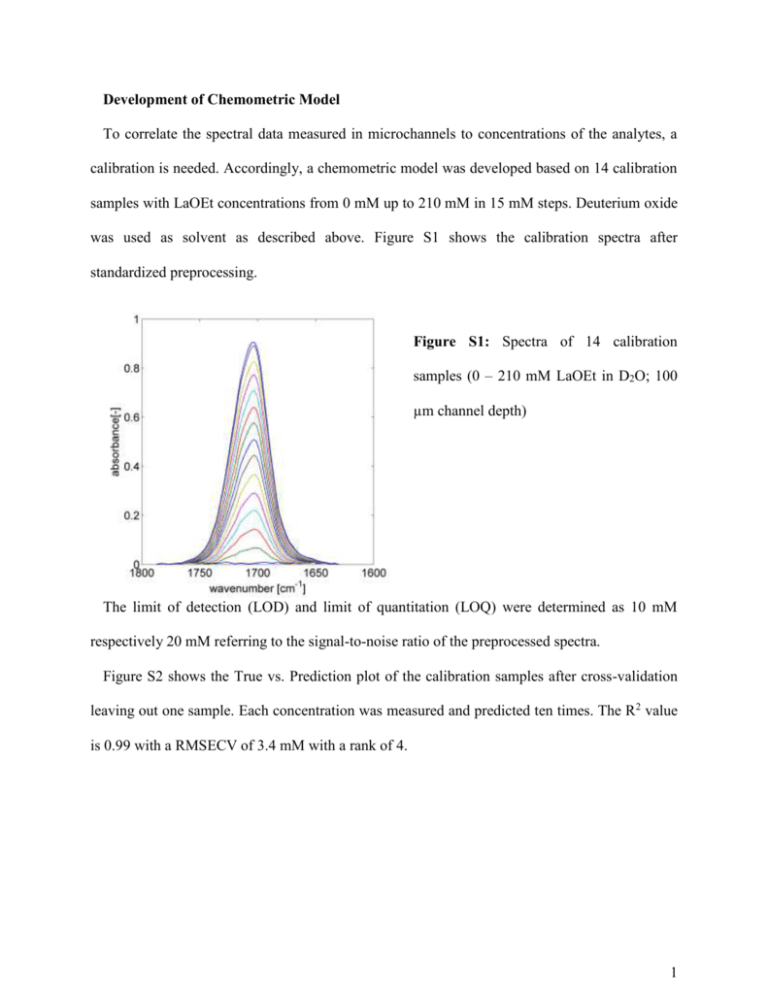
Development of Chemometric Model To correlate the spectral data measured in microchannels to concentrations of the analytes, a calibration is needed. Accordingly, a chemometric model was developed based on 14 calibration samples with LaOEt concentrations from 0 mM up to 210 mM in 15 mM steps. Deuterium oxide was used as solvent as described above. Figure S1 shows the calibration spectra after standardized preprocessing. Figure S1: Spectra of 14 calibration samples (0 – 210 mM LaOEt in D2O; 100 µm channel depth) The limit of detection (LOD) and limit of quantitation (LOQ) were determined as 10 mM respectively 20 mM referring to the signal-to-noise ratio of the preprocessed spectra. Figure S2 shows the True vs. Prediction plot of the calibration samples after cross-validation leaving out one sample. Each concentration was measured and predicted ten times. The R2 value is 0.99 with a RMSECV of 3.4 mM with a rank of 4. 1 Figure S2: True vs. prediction plot for different LaOEt concentrations after crossvalidation of calibration samples (internal validation) The deviation at LaOEt concentrations above 135 mM is lower than 2.5 % and lower than 5 % above 75 mM. At low LaOEt concentrations below 45 mM the deviation exceeds 10 %. These values are comparatively low, considering the LOD and LOQ as mentioned above. Model Application In order to determine the applicability of the chemometric model, samples with concentrations which were not included in the calibration, were analyzed. Four samples with approx. 50, 100, 150 and 200 mM LaOEt in D2O were prepared and measured as described above. The chemometric model (previous section) was used to predict the LaOEt concentration (external validation). Besides, the concentration was verified via GC analysis. Figure S3 shows the true vs. prediction plot for the test samples. The model predicts the concentration satisfactorily in the overall concentration range. Table 1 compares the true and predicted concentration for each test sample. 2 Figure S3: True vs. prediction plot for different concentrations after test-set validation (model application) Table 1: Comparison of true and predicted values for the external validation true concentration [mM] predicted concentration [mM]deviation [mM] deviation [%] 203.1 201.44 1.66 0.89 154.6 151.99 2.61 1.69 105.6 101.23 4.37 4.14 45.2 49.99 4.79 10.59 The test-set validation applying the chemometric model depicts the same appearance as the internal validation in the previous section. The deviation is lower than 5 % at LaOEt concentrations above 100 mM and exceeds 10 % at a true concentration of 45.2 mM. 3

