S2. Metabolon metabolomics platform: Sample processing, data
advertisement
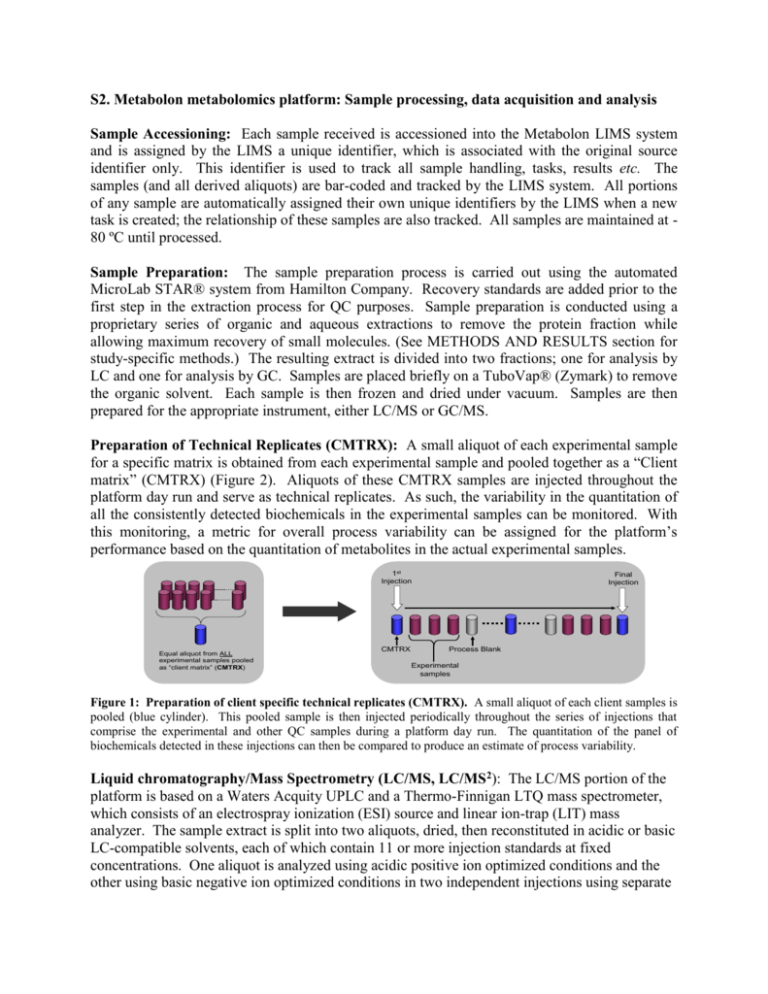
S2. Metabolon metabolomics platform: Sample processing, data acquisition and analysis Sample Accessioning: Each sample received is accessioned into the Metabolon LIMS system and is assigned by the LIMS a unique identifier, which is associated with the original source identifier only. This identifier is used to track all sample handling, tasks, results etc. The samples (and all derived aliquots) are bar-coded and tracked by the LIMS system. All portions of any sample are automatically assigned their own unique identifiers by the LIMS when a new task is created; the relationship of these samples are also tracked. All samples are maintained at 80 ºC until processed. Sample Preparation: The sample preparation process is carried out using the automated MicroLab STAR® system from Hamilton Company. Recovery standards are added prior to the first step in the extraction process for QC purposes. Sample preparation is conducted using a proprietary series of organic and aqueous extractions to remove the protein fraction while allowing maximum recovery of small molecules. (See METHODS AND RESULTS section for study-specific methods.) The resulting extract is divided into two fractions; one for analysis by LC and one for analysis by GC. Samples are placed briefly on a TuboVap® (Zymark) to remove the organic solvent. Each sample is then frozen and dried under vacuum. Samples are then prepared for the appropriate instrument, either LC/MS or GC/MS. Preparation of Technical Replicates (CMTRX): A small aliquot of each experimental sample 30% of samples for a specific matrix is obtained from each experimental sample and pooled together as a “Client dedicated to quality control matrix” (CMTRX) (Figure 2). Aliquots of these CMTRX samples are injected throughout the platform day run and serve as technical replicates. As such, the variability in the quantitation of all the consistently detected biochemicals in the experimental samples can be monitored. With this monitoring, a metric for overall process variability can be assigned for the platform’s performance based on the quantitation of metabolites in the actual experimental samples. + Recovery Standards Sample + Internal Standards Extraction/recovery 1st Injection Equal aliquot from ALL experimental samples pooled as “client matrix” (CMTRX) CMTRX Injection into Instrument Final Injection Process Blank Experimental samples Figure 1: Preparation of client specific technical replicates (CMTRX). A small aliquot of each client samples is pooled (blue cylinder). This pooled sample is then injected periodically throughout the series of injections that comprise the experimental and other QC samples during a platform day run. The quantitation of the panel of biochemicals detected in these injections can then be compared to produce an estimate of process variability. Liquid chromatography/Mass Spectrometry (LC/MS, LC/MS2): The LC/MS portion of the platform is based on a Waters Acquity UPLC and a Thermo-Finnigan LTQ mass spectrometer, which consists of an electrospray ionization (ESI) source and linear ion-trap (LIT) mass analyzer. The sample extract is split into two aliquots, dried, then reconstituted in acidic or basic LC-compatible solvents, each of which contain 11 or more injection standards at fixed concentrations. One aliquot is analyzed using acidic positive ion optimized conditions and the other using basic negative ion optimized conditions in two independent injections using separate dedicated columns. Extracts reconstituted in acidic conditions are gradient eluted using water and methanol both containing 0.1% formic acid, while the basic extracts, which also use water/methanol, contain 6.5mM ammonium bicarbonate. The MS analysis alternates between MS and data-dependent MS2 scans using dynamic exclusion. Accurate Mass Determination and MS/MS fragmentation (LC/MS), (LC/MS/MS): The LC/MS accurate mass portion of the platform is based on a Waters Acquity UPLC and a Thermo-Finnigan LTQ-FT mass spectrometer, which has a linear ion-trap (LIT) front end and a Fourier transform ion cyclotron resonance (FT-ICR) mass spectrometer backend. For ions with counts greater than 2 million, an accurate mass measurement can be performed. Accurate mass measurements can be made on the parent ion as well as fragments. The typical mass error is less than 5 ppm. Ions with less than two million counts require a greater amount of effort to characterize. Fragmentation spectra (MS/MS) are typically generated in data dependent manner, but if necessary, targeted MS/MS can be employed, such as in the case of lower level signals. Gas chromatography / Mass Spectroscopy (GC/MS): The samples destined for GC/MS analysis are re-dried under vacuum desiccation for a minimum of 24 hours prior to being derivatized under dried nitrogen using bistrimethyl-silyl-triflouroacetamide (BSTFA). The GC column is 5% phenyl and the temperature ramp is from 40° to 300° C in a 16 minute period. Samples are analyzed on a Thermo-Finnigan Trace DSQ fast-scanning single-quadrupole mass spectrometer using electron impact ionization. The instrument is tuned and calibrated for mass resolution and mass accuracy on a daily basis. The information output from the raw data files are automatically extracted as discussed below. Bioinformatics: The informatics system consists of four major components, the Laboratory Information Management System (LIMS), the data extraction and peak-identification software, data processing tools for QC and compound identification, and a collection of information interpretation and visualization tools for use by data analysts. The hardware and software foundations for these informatics components are the LAN backbone, and a database server running Oracle 10.2.0.1 Enterprise Edition. LIMS: The purpose of the Metabolon LIMS system is to enable fully auditable laboratory automation through a secure, easy to use, and highly specialized system. The scope of the Metabolon LIMS system encompasses sample accessioning, sample preparation and instrumental analysis and reporting and advanced data analysis. All of the subsequent software systems are grounded in the LIMS data structures. It has been modified to leverage and interface with the inhouse information extraction and data visualization systems, as well as third party instrumentation and data analysis software. Data Extraction and Quality Assurance: The data extraction of the raw mass spec data files yields information that can be loaded into a relational database and manipulated without resorting to BLOB manipulation. Once in the database the information is examined and appropriate QC limits are imposed. Peaks are identified using Metabolon’s proprietary peak integration software, and component parts are stored in a separate and specifically designed complex data structure. Compound identification: Biochemicals are identified by comparison to library entries of purified standards or recurrent unknown entities. Identification of known chemical entities is based on comparison to metabolomic library entries of purified standards. As of this writing, approximately 1500 commercially available purified standard biochemicals have been acquired and registered into LIMS for distribution to both the LC and GC platforms, for determination of their analytical characteristics. The combination of chromatographic properties and mass spectra give an indication of a match to the specific compound or an isobaric entity. Additional chemical entities can be identified by virtue of their recurrent nature (both chromatographic and mass spectral). These biochemicals have the potential to be identified by future acquisition of a matching purified standard or by classical structural analysis. Curation: A variety of curation procedures are carried out to ensure that a high quality data set is made available for statistical analysis and data interpretation. The QC and curation processes are designed to ensure accurate and consistent identification of true chemical entities, and to remove those representing system artifacts, mis-assignments, and background noise. Metabolon data analysts use proprietary visualization and interpretation software to confirm the consistency of peak identification among the various samples. Library matches for each compound are checked for each sample and corrected if necessary. Normalization: For studies spanning multiple days, a data normalization step is performed to correct variation resulting from instrument inter-day tuning differences. Essentially, each compound is corrected in run-day blocks by registering the medians to equal one (1.00) and normalizing each data point proportionately (termed the “block correction”). For studies that do not require more than one day of analysis, no normalization is necessary, other than for purposes of data visualization. A. B. 1 2 3 4 Day 5 6 7 1 2 3 4 Day 5 6 7

