Table 2: Comparison of basic data collected in
advertisement
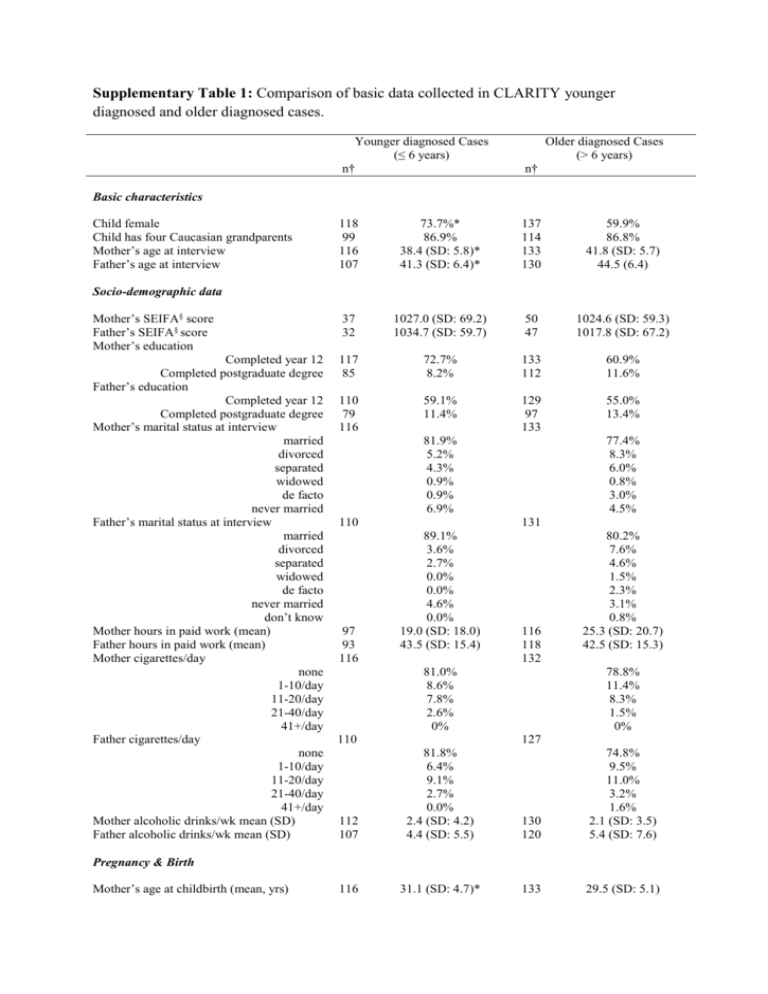
Supplementary Table 1: Comparison of basic data collected in CLARITY younger diagnosed and older diagnosed cases. Younger diagnosed Cases (≤ 6 years) n† Older diagnosed Cases (> 6 years) n† 118 99 116 107 73.7%* 86.9% 38.4 (SD: 5.8)* 41.3 (SD: 6.4)* 137 114 133 130 59.9% 86.8% 41.8 (SD: 5.7) 44.5 (6.4) Mother’s SEIFA§ score Father’s SEIFA§ score Mother’s education 37 32 1027.0 (SD: 69.2) 1034.7 (SD: 59.7) 50 47 1024.6 (SD: 59.3) 1017.8 (SD: 67.2) Completed year 12 Completed postgraduate degree Father’s education Completed year 12 Completed postgraduate degree Mother’s marital status at interview married divorced separated widowed de facto never married Father’s marital status at interview married divorced separated widowed de facto never married don’t know Mother hours in paid work (mean) Father hours in paid work (mean) Mother cigarettes/day none 1-10/day 11-20/day 21-40/day 41+/day Father cigarettes/day none 1-10/day 11-20/day 21-40/day 41+/day Mother alcoholic drinks/wk mean (SD) Father alcoholic drinks/wk mean (SD) 117 85 72.7% 8.2% 133 112 60.9% 11.6% 110 79 116 59.1% 11.4% 129 97 133 55.0% 13.4% Basic characteristics Child female Child has four Caucasian grandparents Mother’s age at interview Father’s age at interview Socio-demographic data 81.9% 5.2% 4.3% 0.9% 0.9% 6.9% 110 97 93 116 77.4% 8.3% 6.0% 0.8% 3.0% 4.5% 131 89.1% 3.6% 2.7% 0.0% 0.0% 4.6% 0.0% 19.0 (SD: 18.0) 43.5 (SD: 15.4) 116 118 132 81.0% 8.6% 7.8% 2.6% 0% 110 80.2% 7.6% 4.6% 1.5% 2.3% 3.1% 0.8% 25.3 (SD: 20.7) 42.5 (SD: 15.3) 78.8% 11.4% 8.3% 1.5% 0% 127 112 107 81.8% 6.4% 9.1% 2.7% 0.0% 2.4 (SD: 4.2) 4.4 (SD: 5.5) 130 120 74.8% 9.5% 11.0% 3.2% 1.6% 2.1 (SD: 3.5) 5.4 (SD: 7.6) 116 31.1 (SD: 4.7)* 133 29.5 (SD: 5.1) Pregnancy & Birth Mother’s age at childbirth (mean, yrs) Father’s age at childbirth (mean, yrs) Planned pregnancy planned natural planned assisted unplanned Child adopted Mother smoked during this pregnancy Nil Less than daily 1-10/day 11-20/day 21-40/day 41+/day Father smoked during this pregnancy Nil Less than daily 1-10/day 11-20/day 21-40/day 41+/day Mother major illness during pregnancy Mother meds/supps during pregnancy multivitamins folate calcium iron vitamin D fish oil antibiotics other Mother any alcohol during pregnancy Mother any coffee during pregnancy Child’s gestation (mean, weeks) Child mode of delivery normal vaginal assisted vaginal caesarian other 107 118 Child birthweight (mean, g) Child birthlength (mean, cm) Child head circumference (mean, cm) Child in multiple birth Child birth order (all live-born sibs) mean 105 92 77 115 118 3361.1 (SD: 533.8) 50.1 (SD: 2.6) 35.0 (SD: 3.4) 0.9%* 1.9 (SD:1.1) 114 97 80 131 137 3358.3 (SD: 685.0) 50.2 (SD: 4.0) 34.7 (SD: 2.7) 6.1% 1.9 (SD: 1.0) any if any, age started (wks) (mean, SD) if any, weeks breastfed (mean, SD) Child formula feeding age started (weeks) weeks formula fed Child cow’s milk commence age (weeks) Child solids commence age (weeks) 117 104 103 90.6% 0.4 (SD 1.7) 39.3 (SD 32.1) 136 109 107 82.4% 0.3 (SD 1.6) 34.1 (SD 27.9) 81 106 102 109 19.8 (SD 20.1) 32.7 (SD 39.6) 59.3 (SD 17.1) 22.4 (SD 5.4) 108 127 114 119 17.3 (SD 20.0) 37.4 (29.9) 58.6 (SD 18.4) 25.9 (SD 21.9) Mother smokes indoors near child 109 137 116 34.1 (SD: 5.7)* 80.5% 72.0% 8.5% 19.5% 0% 130 137 118 133 83.6% 8.6% 3.5% 3.5% 0.9% 0% 107 118 115 116 116 116 116 116 116 115 114 114 99 37 32.2 (SD: 5.7) 78.8% 74.5% 4.4% 21.2% 0% 84.2% 3.8% 8.3% 3.8% 0% 0% 123 82.2% 1.9% 5.6% 8.4% 1.9% 0.0% 29.6% 28.7% 69.0% 12.7% 30.2% 4.3% 4.3% 3.5% 13.9% 19.3% 57.0% 39.4 (SD: 1.6) 136 123 123 123 123 123 123 123 122 134 132 107 50 64.9% 10.8% 21.6% 2.7% 71.5% 4.1% 4.9% 13.8% 4.9% 0.8% 22.1% 21.1% 55.3% 8.9% 39.0% 2.4% 1.6% 4.1% 8.2% 17.2% 54.6% 39.2 (SD: 2.0) 62.0% 14.0% 24.0% 0% Early Life Child breastfeeding usually sometimes 125 0.0% 1.8% 1.6% 5.6% never Father smokes indoors near child 98.2% 103 usually sometimes never 92.8% 123 0.0% 1.0% 99.0%* 2.4% 5.7% 91.9% † Number of observations * p < 0.05 vs older diagnosed cases by unadjusted logistic regression. See text for outcomes of adjusted analyses. § SEIFA = Socio-Economic Indexes for Areas, a measure of residential positional disadvantage based on the Australian Bureau of Statistics Census of Population and Housing. The higher the score, the lower the disadvantage.
