Chapter 4 Homework
advertisement
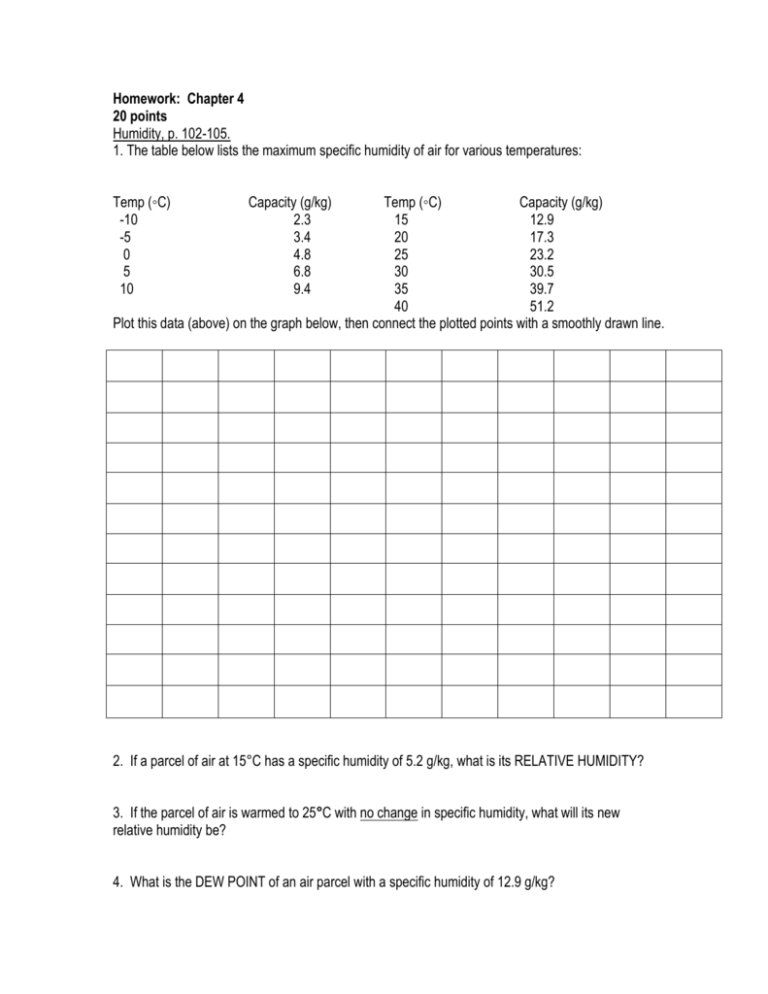
Homework: Chapter 4 20 points Humidity, p. 102-105. 1. The table below lists the maximum specific humidity of air for various temperatures: Temp (◦C) -10 -5 0 5 10 Capacity (g/kg) 2.3 3.4 4.8 6.8 9.4 Temp (◦C) Capacity (g/kg) 15 12.9 20 17.3 25 23.2 30 30.5 35 39.7 40 51.2 Plot this data (above) on the graph below, then connect the plotted points with a smoothly drawn line. 2. If a parcel of air at 15°C has a specific humidity of 5.2 g/kg, what is its RELATIVE HUMIDITY? 3. If the parcel of air is warmed to 25°C with no change in specific humidity, what will its new relative humidity be? 4. What is the DEW POINT of an air parcel with a specific humidity of 12.9 g/kg? 5. The outside air is 5°C and a relative humidity of 60%. a. What is the air’s specific humidity? b. If the air is brought indoors and heated to 20°C, with no increase in specific humidity, what will its new relative humidity be? c. For comfort, relative humidity indoors should be at least 40%. How much water vapor would you need to add to this air at 20 C to reach this level of comfort? 6. What is the relationship between temperature and relative humidity at a constant specific humidity? Adiabatic Processes, p. 105-107. When air is cooled to its dew point temperature, condensation can occur. Clouds and fog are the result of this cooling. The cooling process that creates clouds occurs in the atmosphere. This process accounts for the distribution of condensation and precipitation over the Earth’s surface. The DALR (Dry Adiabatic Lapse Rate) = 10◦C/1000m. Rising air parcels that have not yet become saturated (reached their dew point temperature or lifting condensation level) will cool at this rate. Likewise, sinking air parcels will warm at this rate and no possibility of condensation exists. The MALR (Moist Adiabatic Lapse Rate) = 5◦C/1000m. This occurs after the rising air parcel has reached its dew point temperature, or lifting condensation level, but continues to rise. The rate of cooling is slower than the DALR as energy is released in the form of latent heat. The ELR (Environmental Lapse Rate) = 6.5◦C/1000m. (Chapter 3, p. 76-77). This is an average rate of change for air that is not moving. Because it is an average, the actual ELR varies day to day and even hour to hour. A parcel of air is crossing California—from the west coast at Eureka, over the Coast Ranges, over Red Bluff in the Central Valley, over the Sierra Nevada mountains in the east, and descends into Reno, Nevada. The ELR on this day is 8◦C/1000m. Dew point temperature for parcel is 3◦C. Temperature of air parcel at sea level is 18◦C. On the graph below, plot and label the Environmental Lapse Rate (ELR). Then plot the DALR and the MALR (these should be continuations of the same line, but use different colors to illustrate the change). 7. When the parcel of air reaches the Coast Ranges (2000m), will clouds form? Why or why not? 8. At what ELEVATION does condensation begin? This is the lifting condensation level. Why? 9. Describe the difference in climate between Blue Canyon, CA and Reno, NV. Discuss differences in precipitation, summer and winter temperatures and causes.
