Fall 00/01
advertisement
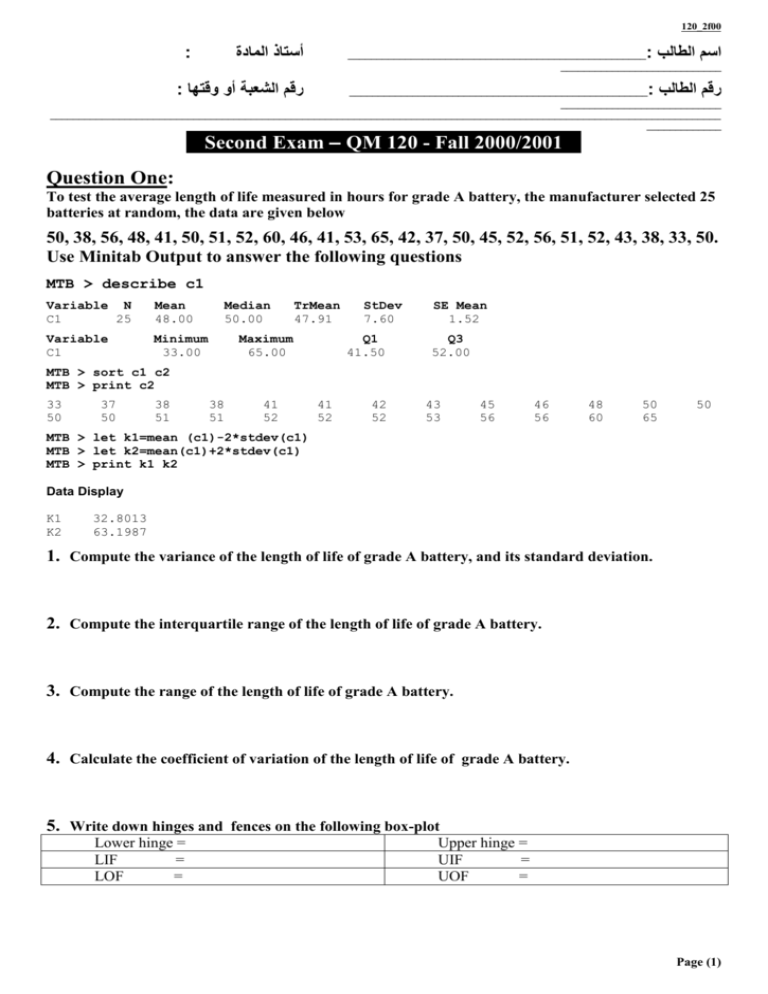
120_2f00 : أستاذ المادة : اسم الطالب ____________________________________________________ ____________________________ : رقم الشعبة أو وقتها : رقم الطالب ____________________________________________________ ____________________________ _____________________________________________________________________________________________________________________ _____________ Second Exam – QM 120 - Fall 2000/2001 Question One: To test the average length of life measured in hours for grade A battery, the manufacturer selected 25 batteries at random, the data are given below 50, 38, 56, 48, 41, 50, 51, 52, 60, 46, 41, 53, 65, 42, 37, 50, 45, 52, 56, 51, 52, 43, 38, 33, 50. Use Minitab Output to answer the following questions MTB > describe c1 Variable N C1 25 Mean 48.00 Variable C1 Minimum 33.00 Median 50.00 TrMean 47.91 Maximum 65.00 StDev 7.60 Q1 41.50 SE Mean 1.52 Q3 52.00 MTB > sort c1 c2 MTB > print c2 33 50 37 50 38 51 38 51 41 52 41 52 42 52 43 53 45 56 46 56 48 60 50 65 50 MTB > let k1=mean (c1)-2*stdev(c1) MTB > let k2=mean(c1)+2*stdev(c1) MTB > print k1 k2 Data Display K1 K2 32.8013 63.1987 1. Compute the variance of the length of life of grade A battery, and its standard deviation. 2. Compute the interquartile range of the length of life of grade A battery. 3. Compute the range of the length of life of grade A battery. 4. Calculate the coefficient of variation of the length of life of grade A battery. 5. Write down hinges and fences on the following box-plot Lower hinge = LIF = LOF = Upper hinge = UIF = UOF = Page (1) 120_2f00 6. From the box-plot the distribution of the data set is skewed to ________________________________ 7. Complete the following sentences from the terms: [any skewness, median, outliers, first quartile] The box plot does not indicate presence of _____________________________ 8. What is the proportion of data set which lie within 2 standard deviation far from the mean? Boxplot --------------------------------I + I-------------------------------------------+---------+---------+---------+---------+---------+C1 36.0 42.0 48.0 54.0 60.0 66.0 9. Is your answer in question 9, closer to chebyshev’s s rule or to the empirical rule? Question Two: In order to promote its product a manufacturing company sends its sales engineers to clients to advertise the product. Two sales engineers A and B will visit two different clients. The probability that the first engineer will make a sale (event A) is 80% , while the second engineer has 70% chance to make a sale (event B). It is also know that P( A B) 40% . 1. Draw Venn diagram 2. What is the probability that only the first engineer will make a sale? 3. What is the probability that exactly one engineer will make a sale? 4. What is the probability that neither one of the two will make a sale? 5. What is the probability that at most one engineer will make a sale? Page (2) 120_2f00 6. At a given day, if the first engineer made a sale what is the probability that the second engineer will make a sale too? 7. Given that the second engineer couldn’t make a sale, what is the probability the first engineer will make a sale? 8. Do you think the two engineers are independent in promoting the product? Question Three: The following table gives a two-way classification of 500 workers selected from a large city: COVERED by health insurance ( C ) NOT COVERED by health insurance ( C) (M) 250 80 WOMEN ( M ) 105 65 MEN I) If one worker is selected at random from this group, find the probability that this worker is: a) covered by health insurance : b) a Men: c) a woman given she is covered by health insurance : d) covered by health insurance and is a woman : Page (3) 120_2f00 e) not covered by health insurance or is a man : II) Are the events “man” and “covered by health insurance” mutually exclusive? Why? III) Are the events “covered by health insurance” and “woman” independent? Why? Question Four: A computer company buys 75% of all compute chips from company “A” and 25% from company “B”. It is known that 1% of all the computer chips received from company “A” are defective, and 2% of all the computer chips received from company “B” are defective. Draw the probability Tree . One computer is found to contain a defective chips. What is the probability that this chip came from company “A”. Page (4)
